

Corak sebenar

Triple Bottom
was formed on 17.04 at 23:00:34 (UTC+0)
signal strength 2 of 5
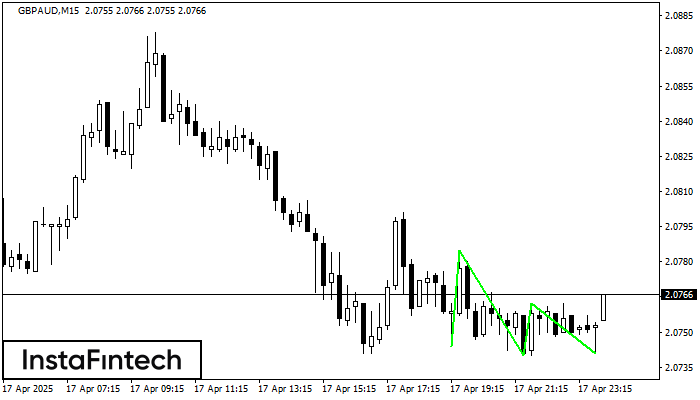
The Triple Bottom pattern has formed on the chart of the GBPAUD M15 trading instrument. The pattern signals a change in the trend from downwards to upwards in the case of breakdown of 2.0785/2.0762.
The M5 and M15 time frames may have more false entry points.
- All
- All
- Bearish Rectangle
- Bearish Symmetrical Triangle
- Bearish Symmetrical Triangle
- Bullish Rectangle
- Double Top
- Double Top
- Triple Bottom
- Triple Bottom
- Triple Top
- Triple Top
- All
- All
- Buy
- Sale
- All
- 1
- 2
- 3
- 4
- 5
รูปแบบสามเหลี่ยมสมมาตรขาลง (Bearish Symmetrical Triangle)
was formed on 30.04 at 06:15:48 (UTC+0)
signal strength 1 of 5

อ้างอิงจากชาร์ตของ M5, USDCHF ที่ได้สร้างรูปแบบ รูปแบบสามเหลี่ยมสมมาตรขาลง (Bearish Symmetrical Triangle) ออกมา รูปแบบนี้แสดงถึงแนวโน้มขาลงที่เกิดขึ้นต่อไป ในกรณีที่ขอบเขตด้านล่าง 0.8226 จะมีการเคลื่อนตัวทะลุผ่าน4f ส่วนนี้ เป็นผลกำไรที่คาดการณ์ไว้
ขอบเตระยะเวลาใน M5 และ M15 อาจจะมีตำแหน่งการเข้าใช้งานที่ผิดพลาดมากยิ่งขึ้น
Open chart in a new window
รูปแบบกราฟจุดสามยอดขาลง (Triple Bottom)
was formed on 30.04 at 05:45:24 (UTC+0)
signal strength 1 of 5

รูปแบบ รูปแบบกราฟจุดสามยอดขาลง (Triple Bottom) ได้สร้างขึ้นมาในชาร์ตของ GBPAUD M5 ลักษณะของกราฟรูปแบบนี้: เส้นด้านล่างของกราฟรูปแบบนี้มีพิกัดอยู่ที่ 2.0938 พร้อมกับลิมิตด้านบน 2.0938/2.0931,ระยะของความกว้างคือ 27 จุด การก่อตัวของกราฟรูปแบบ
ขอบเตระยะเวลาใน M5 และ M15 อาจจะมีตำแหน่งการเข้าใช้งานที่ผิดพลาดมากยิ่งขึ้น
Open chart in a new window
รูปแบบกราฟธงปลายแหลมขาลง (Bearish pennant)
was formed on 30.04 at 05:22:56 (UTC+0)
signal strength 2 of 5

รูปแบบ รูปแบบกราฟธงปลายแหลมขาลง (Bearish pennant) ได้สร้างขึ้นมาในชาร์ต GBPAUD M15 มันแสดงถึงความต่อเนื่องของแนวโน้มปัจจุบัน คุณลักษณะจำเพาะ: ระดับต่ำของรูปแบบนี้จะเป็นพิกัดของ 2.0901;การประมาณการความสูงของตัวเสาธง เท่ากับ 103 บี๊ป ในกรณีที่ราคาเคลื่อนตัวทะลุผ่านระดับต่ำของรูปแบบนี้ที่
ขอบเตระยะเวลาใน M5 และ M15 อาจจะมีตำแหน่งการเข้าใช้งานที่ผิดพลาดมากยิ่งขึ้น
Open chart in a new window


