

Corak sebenar

Bearish Symmetrical Triangle
was formed on 17.04 at 23:30:07 (UTC+0)
signal strength 1 of 5

According to the chart of M5, USDCHF formed the Bearish Symmetrical Triangle pattern. Description: The lower border is 0.8182/0.8188 and upper border is 0.8195/0.8188. The pattern width is measured on the chart at -13 pips. The formation of the Bearish Symmetrical Triangle pattern evidently signals a continuation of the downward trend. In other words, if the scenario comes true and USDCHF breaches the lower border, the price could continue its move toward 0.8173.
The M5 and M15 time frames may have more false entry points.
Juga lihat
- All
- All
- Bearish Rectangle
- Bearish Symmetrical Triangle
- Bearish Symmetrical Triangle
- Bullish Rectangle
- Double Top
- Double Top
- Triple Bottom
- Triple Bottom
- Triple Top
- Triple Top
- All
- All
- Buy
- Sale
- All
- 1
- 2
- 3
- 4
- 5
Triple Piso
was formed on 30.04 at 05:45:24 (UTC+0)
signal strength 1 of 5

El patrón Triple Piso ha sido formado en el gráfico de GBPAUD M5. Características del patrón: línea inferior del patrón tiene coordenadas 2.0938 con el límite superior 2.0938/2.0931, la proyección
Los marcos de tiempo M5 y M15 pueden tener más puntos de entrada falsos.
Open chart in a new window
Banderín bajista
was formed on 30.04 at 05:22:56 (UTC+0)
signal strength 2 of 5

El patrón Banderín bajista se ha formado en el gráfico GBPAUD M15. Esto señala la continuación potencial de la tendencia existente. Especificaciones: el piso del patrón tiene la coordinada
Los marcos de tiempo M5 y M15 pueden tener más puntos de entrada falsos.
Open chart in a new window
Doble Techo
was formed on 30.04 at 05:15:40 (UTC+0)
signal strength 1 of 5
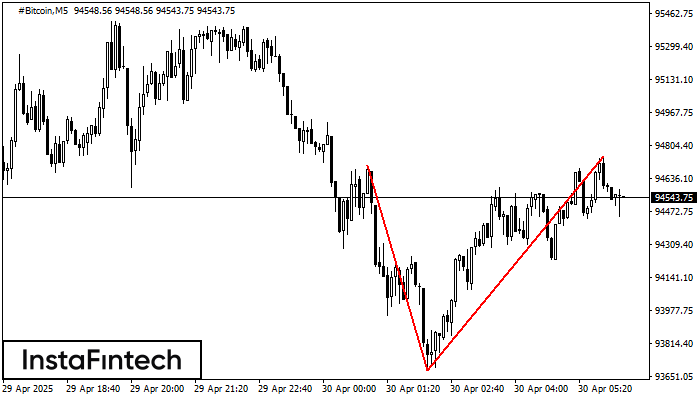
En el gráfico de #Bitcoin M5 el patrón de reversión Doble Techo ha sido formado. Características: límite superior 94746.12; límite inferior 93679.83; el ancho del patrón 106629 puntos. La señal
Los marcos de tiempo M5 y M15 pueden tener más puntos de entrada falsos.
Open chart in a new window

