Actual patterns

Patterns are graphical models which are formed in the chart by the price. According to one of the technical analysis postulates, history (price movement) repeats itself. It means that the price movements are often similar in the same situations which makes it possible to predict the further development of the situation with a high probability.
Relevant patterns by InstaTrade is an easy-to-use service which allows you to be aware of latest changes in the market and react to clues from the market in time. In our service you will always find the latest and most relevant patterns on any pair and any timeframe.
Double Bottom
was formed on 25.03 at 22:00:47 (UTC+0)
signal strength 3 of 5
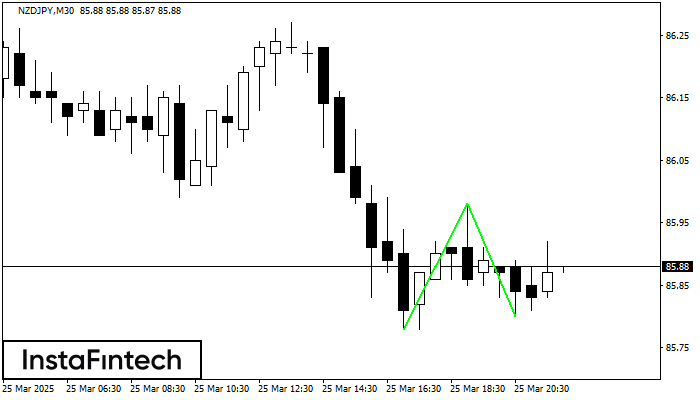
The Double Bottom pattern has been formed on NZDJPY M30. Characteristics: the support level 85.78; the resistance level 85.98; the width of the pattern 20 points. If the resistance level is broken, a change in the trend can be predicted with the first target point lying at the distance of 18 points.
- All
- All
- Bearish Rectangle
- Bearish Symmetrical Triangle
- Bearish Symmetrical Triangle
- Bullish Rectangle
- Double Top
- Double Top
- Triple Bottom
- Triple Bottom
- Triple Top
- Triple Top
- All
- All
- Buy
- Sale
- All
- 1
- 2
- 3
- 4
- 5
Đỉnh ba
was formed on 30.05 at 22:20:23 (UTC+0)
signal strength 1 of 5

Mô hình Đỉnh ba đã được hình thành trên biểu đồ của công cụ giao dịch GOLD M5. Đó là mô hình đảo chiều có các đặc điểm
Khung thời gian M5 và M15 có thể có nhiều điểm vào lệnh sai hơn.
Open chart in a new window
Đảo đầu và vai
was formed on 30.05 at 21:50:24 (UTC+0)
signal strength 1 of 5

Theo biểu đồ của M5, #AMZN đã tạo ra mô hình Đảo đầu và vai. Đầu được cố định ở 201.64 trong khi đường trung bình của Cổ được
Khung thời gian M5 và M15 có thể có nhiều điểm vào lệnh sai hơn.
Open chart in a new window
Hình chữ nhật giảm
was formed on 30.05 at 21:36:36 (UTC+0)
signal strength 1 of 5

Theo biểu đồ của M5, GBPAUD đã hình thành Hình chữ nhật giảm, cái mà là mô hình của sự tiếp tục xu hướng. Mô hình được chứa trong
Khung thời gian M5 và M15 có thể có nhiều điểm vào lệnh sai hơn.
Open chart in a new window