Долзарб паттернлар

Двойная вершина
сформирован 25.03 в 22:17:10 (UTC+0)
сила сигнала 2 из 5
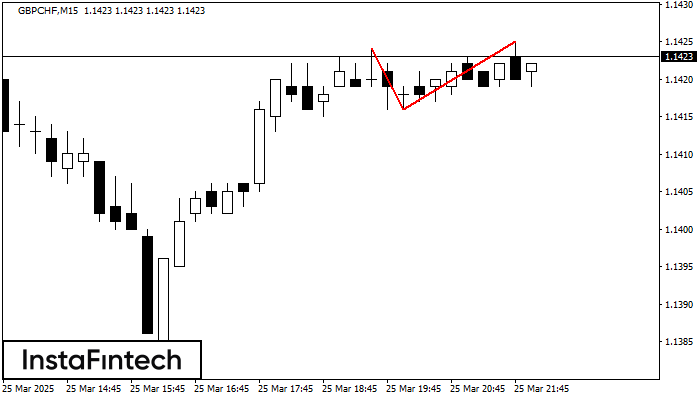
На торговом графике GBPCHF M15 сформировалась разворотная фигура «Двойная вершина». Характеристика: Верхняя граница 1.1425; Нижняя граница 1.1416; Ширина фигуры 9 пунктов. Сигнал: Пробой нижней границы 1.1416 приведет к дальнейшему нисходящему движению с перспективой хода к уровню 1.1394.
Таймфреймы М5 и М15 могут иметь больше ложных точек входа.
Шунингдек кўринг
- Все
- Все
- Bearish Rectangle
- Bearish Symmetrical Triangle
- Bearish Symmetrical Triangle
- Bullish Rectangle
- Double Top
- Double Top
- Triple Bottom
- Triple Bottom
- Triple Top
- Triple Top
- Все
- Все
- Покупка
- Продажа
- Все
- 1
- 2
- 3
- 4
- 5
Bullish Rectangle
was formed on 01.04 at 21:16:19 (UTC+0)
signal strength 2 of 5
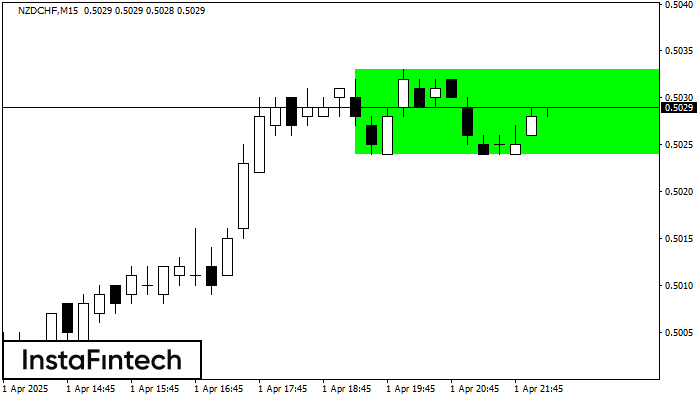
According to the chart of M15, NZDCHF formed the Bullish Rectangle. This type of a pattern indicates a trend continuation. It consists of two levels: resistance 0.5033 and support 0.5024
The M5 and M15 time frames may have more false entry points.
Open chart in a new window
Bullish Rectangle
was formed on 01.04 at 21:01:49 (UTC+0)
signal strength 2 of 5
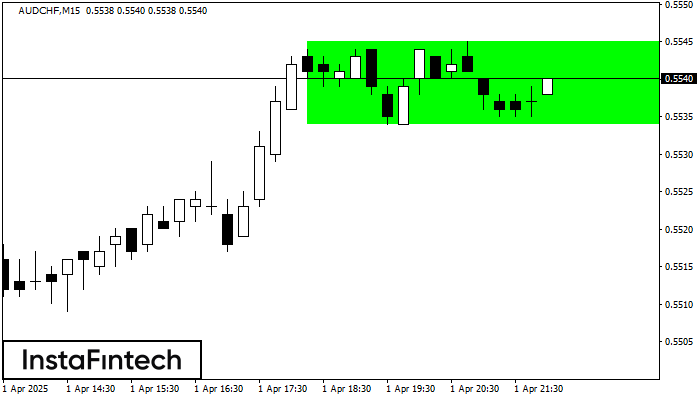
According to the chart of M15, AUDCHF formed the Bullish Rectangle. This type of a pattern indicates a trend continuation. It consists of two levels: resistance 0.5545 and support 0.5534
The M5 and M15 time frames may have more false entry points.
Open chart in a new window
Bullish Rectangle
was formed on 01.04 at 20:57:49 (UTC+0)
signal strength 1 of 5
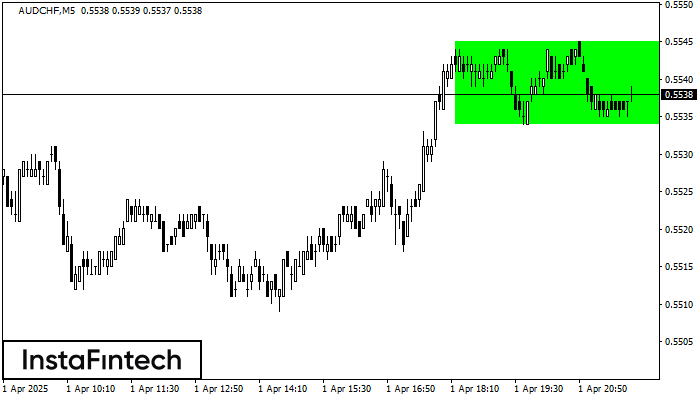
According to the chart of M5, AUDCHF formed the Bullish Rectangle which is a pattern of a trend continuation. The pattern is contained within the following borders: the lower border
The M5 and M15 time frames may have more false entry points.
Open chart in a new window