Долзарб паттернлар

Бычий симметричный треугольник
сформирован 14.04 в 04:00:58 (UTC+0)
сила сигнала 4 из 5

По EURNZD на H1 фигура «Бычий симметричный треугольник». Характеристика: Фигура продолжения тренда; Координаты границ – верхняя 2.0005, нижняя 1.9118. Проекция ширины фигуры 887 пунктов. Прогноз: В случае пробоя верхней границы 2.0005 цена, вероятнее всего, продолжит движение к 1.9525.
- Все
- Все
- Bearish Rectangle
- Bearish Symmetrical Triangle
- Bearish Symmetrical Triangle
- Bullish Rectangle
- Double Top
- Double Top
- Triple Bottom
- Triple Bottom
- Triple Top
- Triple Top
- Все
- Все
- Покупка
- Продажа
- Все
- 1
- 2
- 3
- 4
- 5
Bearish pennant
was formed on 30.04 at 18:45:10 (UTC+0)
signal strength 2 of 5
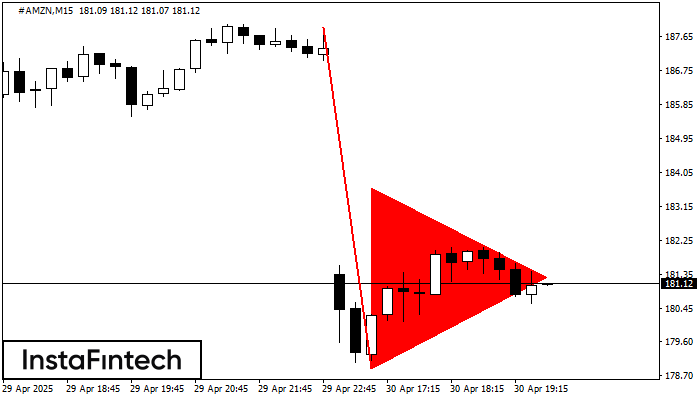
The Bearish pennant pattern has formed on the #AMZN M15 chart. The pattern signals continuation of the downtrend in case the pennant’s low of 178.89 is broken through. Recommendations: Place
The M5 and M15 time frames may have more false entry points.
Open chart in a new window
Double Top
was formed on 30.04 at 18:45:05 (UTC+0)
signal strength 2 of 5
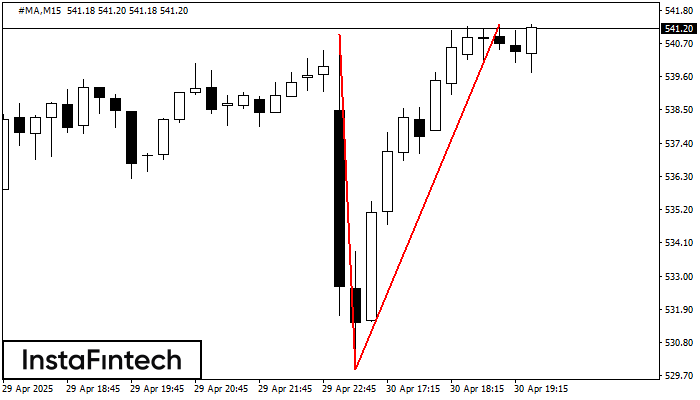
The Double Top reversal pattern has been formed on #MA M15. Characteristics: the upper boundary 540.99; the lower boundary 529.93; the width of the pattern is 1140 points. Sell trades
The M5 and M15 time frames may have more false entry points.
Open chart in a new window
Bearish Symmetrical Triangle
was formed on 30.04 at 18:31:20 (UTC+0)
signal strength 1 of 5
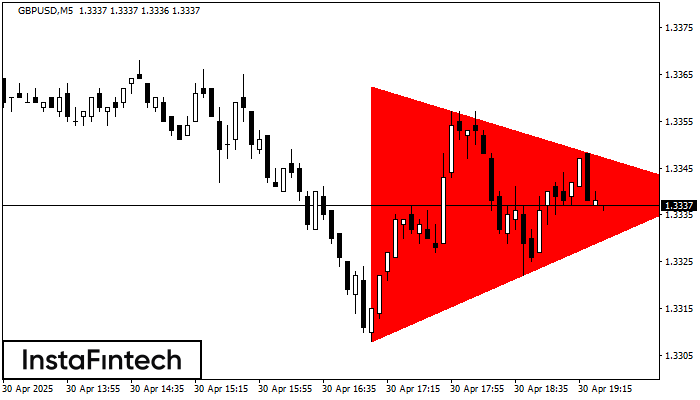
According to the chart of M5, GBPUSD formed the Bearish Symmetrical Triangle pattern. Description: The lower border is 1.3308/1.3340 and upper border is 1.3362/1.3340. The pattern width is measured
The M5 and M15 time frames may have more false entry points.
Open chart in a new window