Долзарб паттернлар

Голова и плечи
сформирован 17.04 в 14:00:03 (UTC+0)
сила сигнала 2 из 5

Графическая фигура «Голова и плечи» сформировалась по инструменту EURCHF на M15. Вероятно предполагать, что после формирования правого плеча цена преодолеет уровень шеи 0.9278/0.9279, изменяя тем самым тенденцию и фактически направляя нас к значению 0.9257.
Таймфреймы М5 и М15 могут иметь больше ложных точек входа.
- Все
- Все
- Bearish Rectangle
- Bearish Symmetrical Triangle
- Bearish Symmetrical Triangle
- Bullish Rectangle
- Double Top
- Double Top
- Triple Bottom
- Triple Bottom
- Triple Top
- Triple Top
- Все
- Все
- Покупка
- Продажа
- Все
- 1
- 2
- 3
- 4
- 5
Double Bottom
was formed on 30.04 at 14:00:47 (UTC+0)
signal strength 3 of 5
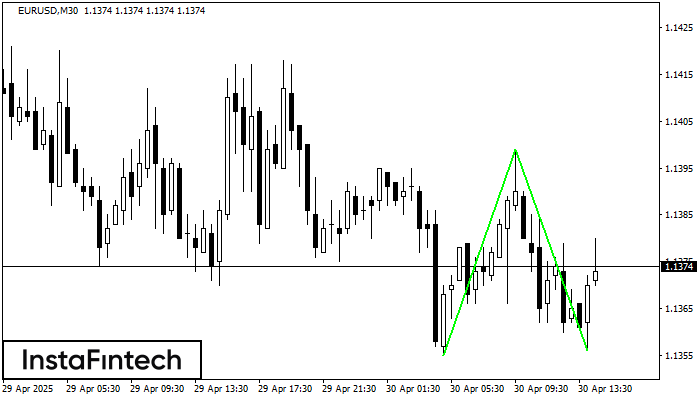
The Double Bottom pattern has been formed on EURUSD M30. Characteristics: the support level 1.1355; the resistance level 1.1399; the width of the pattern 44 points. If the resistance level
Open chart in a new window
Double Bottom
was formed on 30.04 at 13:45:29 (UTC+0)
signal strength 2 of 5
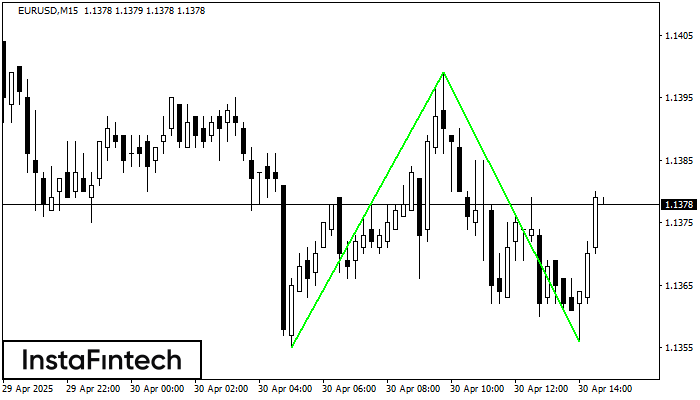
The Double Bottom pattern has been formed on EURUSD M15. Characteristics: the support level 1.1355; the resistance level 1.1399; the width of the pattern 44 points. If the resistance level
The M5 and M15 time frames may have more false entry points.
Open chart in a new window
Triple Bottom
was formed on 30.04 at 13:30:55 (UTC+0)
signal strength 1 of 5
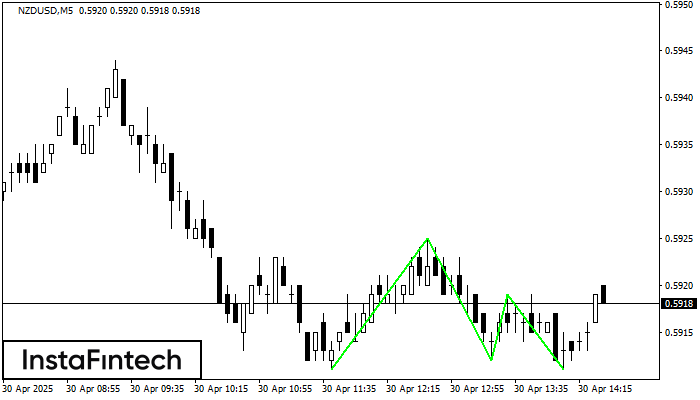
The Triple Bottom pattern has formed on the chart of NZDUSD M5. Features of the pattern: The lower line of the pattern has coordinates 0.5925 with the upper limit 0.5925/0.5919
The M5 and M15 time frames may have more false entry points.
Open chart in a new window