یہ بھی دیکھیں


 21.02.2024 04:08 PM
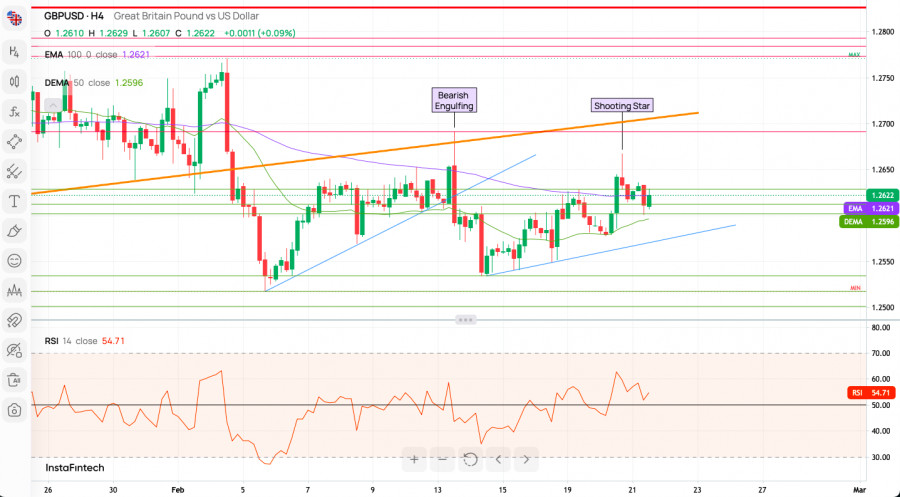
As the GBP/USD pair dances around pivotal moving averages, traders have been closely monitoring the short-term fluctuations that have recently seen the pair break above a crucial supply zone. The technical landscape is now poised on a delicate fulcrum, with potential for either continuation of the uptrend or a sentiment shift to bearish tones.
The 4-hour chart for the GBP/USD pair presents a tableau of consolidation with flirtations above key moving averages that act as battlegrounds for the bulls and bears. A 'Shooting Star' candlestick formation—often considered a bearish reversal pattern—stands in stark contrast to the 'Bearish Engulfing' pattern that preceded it, suggesting that the path of least resistance could be downward.
Despite this, the momentum remains robust and positive, as the pair successfully breached the short-term supply zone between 1.2613 and 1.2595, crafting a new local zenith at 1.2628. The current stance is above the 100-period EMA at 1.2621, giving the bulls a slight edge as they eye the next target at 1.2691.
The GBP/USD pair finds itself in a state of anticipation, with market participants on the lookout for a decisive breakout. The intraday technical supports at 1.2612, 1.2603, and 1.2595 hold the key to maintaining bullish sentiment; a breach below could tilt the scales. The horizontal trend is indicative of a market awaiting catalysts, and with the pair nestled between the 50 and 100 MA, these levels are closely watched.
A mixed signal landscape is presented by technical indicators and moving averages, with an almost even split between sell and buy signals. This indecision is mirrored in the sentiment scoreboard, which currently leans slightly bullish at 55% versus 45% bears, although the last three days have seen a sentiment switch to bearish.
The weekly pivot points provide traders with key levels to watch for potential reversals or continuations.
Traders should consider the mixed sentiment and closely balanced technical indicators as signs to employ prudent risk management strategies. The key will be to watch for either a sustained hold above the 1.2625 (100 MA) region for bullish confirmation or a drop below the 1.2595 support for bearish signals.
Scenario for Bulls: Should the bulls maintain control, a push towards the WR1 at 1.26519, followed by an attempt at WR2 at 1.26671, could be on the cards, aligning with the bullish sentiment on the scoreboard.
Scenario for Bears: For bears, a move below the WS2 pivot point at 1.26111 could confirm a change in sentiment, possibly opening the door to a retest of the key short-term support at 1.2517, the swing low from February 5th, 2024.
Conclusion: The GBP/USD pair remains at a technical crossroads, with the potential for either an upward journey or a downward correction. The upcoming trading sessions will be crucial in determining which force prevails, as traders align their positions with the subtle cues from both technical patterns and market sentiment.
The begginers in forex trading need to be very careful when making decisions about entering the market. Before the release of important reports, it is best to stay out of the market to avoid being caught in sharp market fluctuations due to increased volatility. If you decide to trade during the news release, then always place stop orders to minimize losses.
Without placing stop orders, you can very quickly lose your entire deposit, especially if you do not use money management and trade large volumes. For successful trading, you need to have a clear trading plan and stay focues and disciplined. Spontaneous trading decision based on the current market situation is an inherently losing strategy for a scalper or daytrader.
You have already liked this post today
*تعینات کیا مراد ہے مارکیٹ کے تجزیات یہاں ارسال کیے جاتے ہیں جس کا مقصد آپ کی بیداری بڑھانا ہے، لیکن تجارت کرنے کے لئے ہدایات دینا نہیں.
ایگل انڈیکیٹراوور باٹ سطح پر پہنچ رہا ہے، اس لیے ہم اس کی بلند ترین 3,245 سے نیچے فروخت کے مواقع تلاش کریں گے، جس کے اہداف 3,200، 3,170
آنے والے گھنٹوں کے لیے ہمارا تجارتی منصوبہ 3,224 سے نیچے سونا فروخت کرنا ہے، جس کا ہدف 3,203 اور 3,156 ہے۔ ہمیں کسی بھی تکنیکی بحالی کے لیے چوکنا
ای میل / ایس ایم ایس

Your IP address shows that you are currently located in the USA. If you are a resident of the United States, you are prohibited from using the services of InstaFintech Group including online trading, online transfers, deposit/withdrawal of funds, etc.
If you think you are seeing this message by mistake and your location is not the US, kindly proceed to the website. Otherwise, you must leave the website in order to comply with government restrictions.
Why does your IP address show your location as the USA?
Please confirm whether you are a US resident or not by clicking the relevant button below. If you choose the wrong option, being a US resident, you will not be able to open an account with InstaTrade anyway.
We are sorry for any inconvenience caused by this message.


