یہ بھی دیکھیں

 19.09.2024 02:02 PM
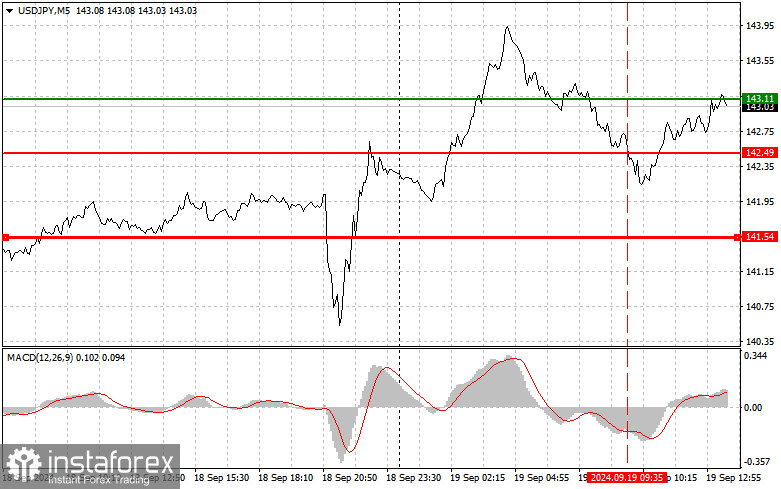
The test of 142.49 occurred when the MACD indicator had already moved significantly below the zero line, limiting the pair's downward potential—especially after the bullish market seen during the Asian trading session. For this reason, I avoided selling the dollar. U.S. existing home sales data will be of particular interest to traders in the second half of the day, along with initial jobless claims and the Philadelphia Fed manufacturing index. Strong economic data will bring buyers back into the market, leading to further upward movement in USD/JPY. For the intraday strategy, I plan to follow scenarios #1 and #2.
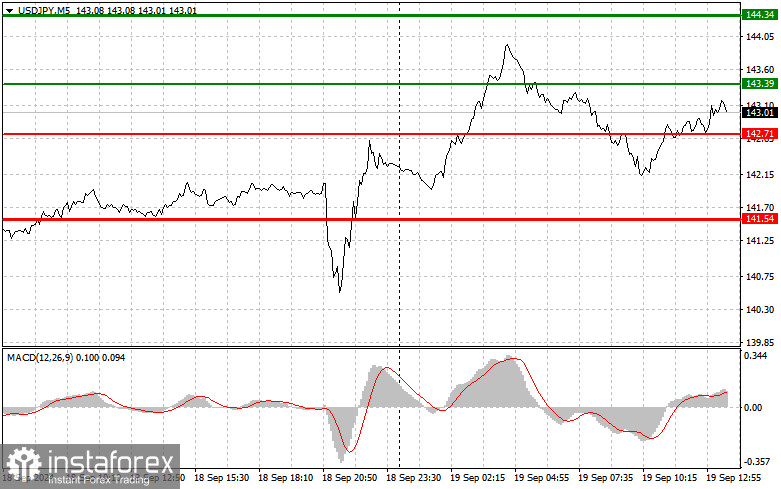
Scenario #1: Today, I plan to buy USD/JPY at the entry point around 143.39 (green line on the chart) with a target of 144.34 (thicker green line on the chart). Around 144.34, I will exit the buy position and open a sell position in the opposite direction, aiming for a 30-35 point movement from the entry point. The pair is likely to rise today only after a hawkish stance from the Federal Reserve.Note: Before buying, ensure the MACD indicator is above the zero line and just starting to rise.
Scenario #2: I also plan to buy USD/JPY today if the 142.71 level is tested twice and the MACD indicator is in the oversold zone. This will limit the pair's downward potential and trigger a reversal back up. You can expect a rise toward the resistance levels of 143.39 and 144.34.
Scenario #1: I plan to sell USD/JPY today after breaking below the 142.71 level (red line on the chart), which will lead to a quick decline in the pair. The key target for sellers will be 141.54, where I will exit the sell and immediately open a buy in the opposite direction (targeting a 20-25 point movement from that level). Pressure on the pair will return if buyer activity near the daily high is lacking.Note: Before selling, ensure the MACD indicator is below the zero line and has just started its downward move.
Scenario #2: I also plan to sell USD/JPY today if the 143.39 level is tested twice and the MACD indicator is in the overbought zone. This will limit the pair's upward potential and trigger a reversal back down. You can expect a decline toward the levels of 142.71 and 141.54.
Beginner forex traders should be very cautious when making entry decisions. It is best to stay out of the market before important fundamental reports to avoid sharp price fluctuations. If trading during news releases, ensure that stop orders are placed to minimize losses. Without stop orders, you can quickly lose your entire deposit, especially if trading large volumes without proper money management.
Remember, successful trading requires a clear trading plan, like the one presented above. Spontaneous trading decisions based on the current market situation are typically unprofitable for intraday traders.
You have already liked this post today
*تعینات کیا مراد ہے مارکیٹ کے تجزیات یہاں ارسال کیے جاتے ہیں جس کا مقصد آپ کی بیداری بڑھانا ہے، لیکن تجارت کرنے کے لئے ہدایات دینا نہیں.


