Actual patterns

Patterns are graphical models which are formed in the chart by the price. According to one of the technical analysis postulates, history (price movement) repeats itself. It means that the price movements are often similar in the same situations which makes it possible to predict the further development of the situation with a high probability.
Relevant patterns by InstaTrade is an easy-to-use service which allows you to be aware of latest changes in the market and react to clues from the market in time. In our service you will always find the latest and most relevant patterns on any pair and any timeframe.
Triple Top
was formed on 17.04 at 16:29:58 (UTC+0)
signal strength 2 of 5
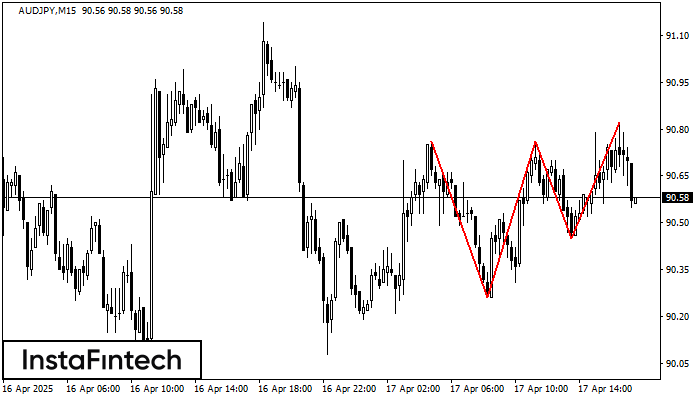
The Triple Top pattern has formed on the chart of the AUDJPY M15. Features of the pattern: borders have an ascending angle; the lower line of the pattern has the coordinates 90.26/90.45 with the upper limit 90.76/90.82; the projection of the width is 50 points. The formation of the Triple Top figure most likely indicates a change in the trend from upward to downward. This means that in the event of a breakdown of the support level of 90.26, the price is most likely to continue the downward movement.
The M5 and M15 time frames may have more false entry points.
- All
- All
- Bearish Rectangle
- Bearish Symmetrical Triangle
- Bearish Symmetrical Triangle
- Bullish Rectangle
- Double Top
- Double Top
- Triple Bottom
- Triple Bottom
- Triple Top
- Triple Top
- All
- All
- Buy
- Sale
- All
- 1
- 2
- 3
- 4
- 5
Đáy đôi
was formed on 31.05 at 13:20:01 (UTC+0)
signal strength 1 of 5

Mô hình Đáy đôi đã được hình thành trên #Bitcoin M5. Đặc điểm: mức hỗ trợ 103250.25; mức kháng cự 103385.09; chiều rộng của mô hình 13484 điểm
Khung thời gian M5 và M15 có thể có nhiều điểm vào lệnh sai hơn.
Open chart in a new window
Đỉnh ba
was formed on 30.05 at 22:20:23 (UTC+0)
signal strength 1 of 5

Mô hình Đỉnh ba đã được hình thành trên biểu đồ của công cụ giao dịch GOLD M5. Đó là mô hình đảo chiều có các đặc điểm
Khung thời gian M5 và M15 có thể có nhiều điểm vào lệnh sai hơn.
Open chart in a new window
Đảo đầu và vai
was formed on 30.05 at 21:50:24 (UTC+0)
signal strength 1 of 5

Theo biểu đồ của M5, #AMZN đã tạo ra mô hình Đảo đầu và vai. Đầu được cố định ở 201.64 trong khi đường trung bình của Cổ được
Khung thời gian M5 và M15 có thể có nhiều điểm vào lệnh sai hơn.
Open chart in a new window