

Padrões atuais

Padrões são modelos gráficos que são formados no gráfico pelo preço. Segundo um dos postulados da análise técnica, a história (movimento de preços) se repete. Isso significa que os movimentos de preços geralmente são semelhantes nas mesmas situações, o que possibilita prever o desenvolvimento futuro da situação com alta probabilidade.
Os padrões relevantes da InstaTrade são um serviço fácil de usar, que permite que você esteja ciente das últimas mudanças no mercado e reaja a indícios do mercado a tempo. Em nosso serviço, você sempre encontrará os padrões mais recentes e relevantes em qualquer par e em qualquer período gráfico.
Double Bottom
was formed on 25.03 at 22:00:47 (UTC+0)
signal strength 3 of 5
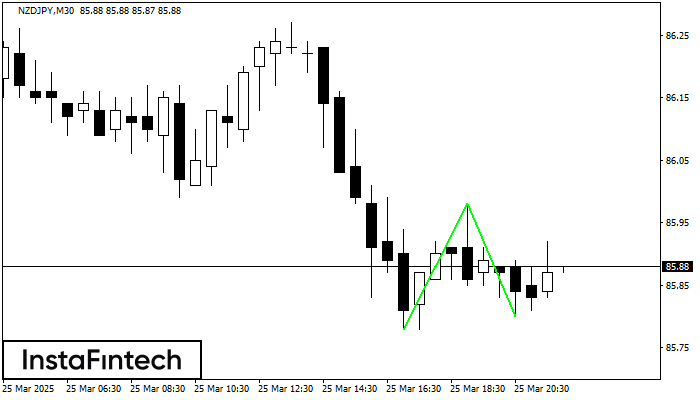
The Double Bottom pattern has been formed on NZDJPY M30. Characteristics: the support level 85.78; the resistance level 85.98; the width of the pattern 20 points. If the resistance level is broken, a change in the trend can be predicted with the first target point lying at the distance of 18 points.
Veja também
- All
- All
- Bearish Rectangle
- Bearish Symmetrical Triangle
- Bearish Symmetrical Triangle
- Bullish Rectangle
- Double Top
- Double Top
- Triple Bottom
- Triple Bottom
- Triple Top
- Triple Top
- All
- All
- Buy
- Sale
- All
- 1
- 2
- 3
- 4
- 5
Topo duplo
was formed on 30.04 at 08:10:41 (UTC+0)
signal strength 1 of 5
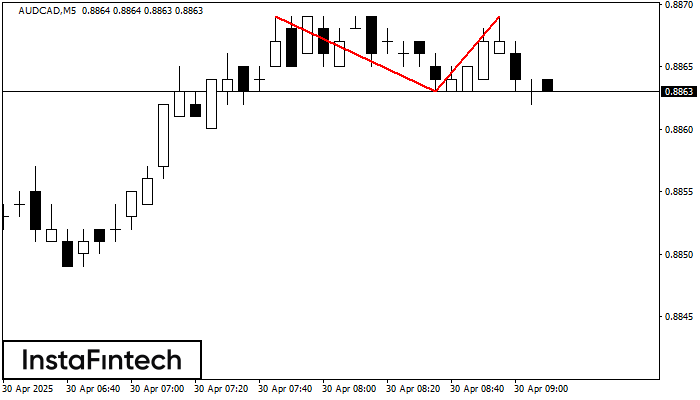
O padrão Topo duplo foi formado em AUDCAD M5. Isso sinaliza que a tendência foi alterada de cima para baixo. Provavelmente, se a base do padrão 0.8863 for quebrada
Os intervalos M5 e M15 podem ter mais pontos de entrada falsos.
Open chart in a new window
Fundo duplo
was formed on 30.04 at 08:00:27 (UTC+0)
signal strength 3 of 5
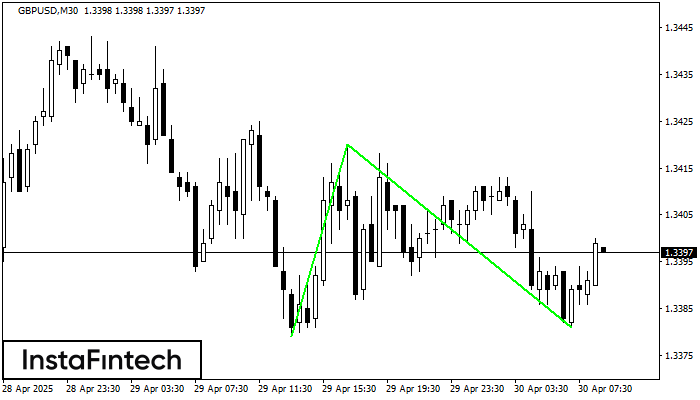
O padrão Fundo duplo foi formado em GBPUSD M30. Características: o nível de suporte 1.3379; o nível de resistência 1.3420; a largura do padrão 41 pontos. Se o nível
Open chart in a new window
Topo triplo
was formed on 30.04 at 07:55:10 (UTC+0)
signal strength 1 of 5
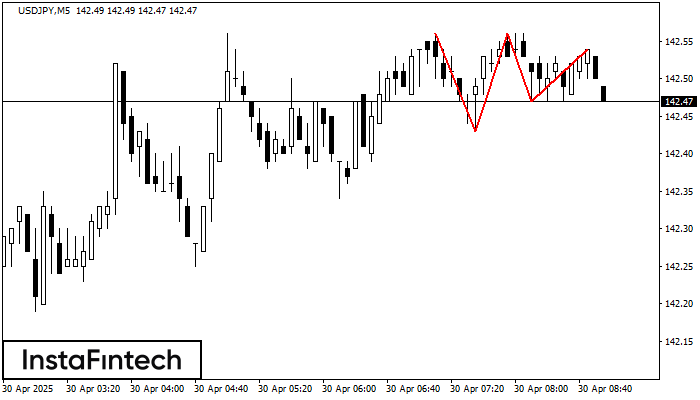
O padrão Topo triplo se formou no gráfico de USDJPY M5. Características do padrão: os limites têm um ângulo ascendente; a linha inferior do padrão tem as coordenadas 142.43/142.47
Os intervalos M5 e M15 podem ter mais pontos de entrada falsos.
Open chart in a new window


