Padrões atuais

Padrões são modelos gráficos que são formados no gráfico pelo preço. Segundo um dos postulados da análise técnica, a história (movimento de preços) se repete. Isso significa que os movimentos de preços geralmente são semelhantes nas mesmas situações, o que possibilita prever o desenvolvimento futuro da situação com alta probabilidade.
Os padrões relevantes da InstaTrade são um serviço fácil de usar, que permite que você esteja ciente das últimas mudanças no mercado e reaja a indícios do mercado a tempo. Em nosso serviço, você sempre encontrará os padrões mais recentes e relevantes em qualquer par e em qualquer período gráfico.
Bullish Rectangle
was formed on 01.04 at 20:31:48 (UTC+0)
signal strength 1 of 5
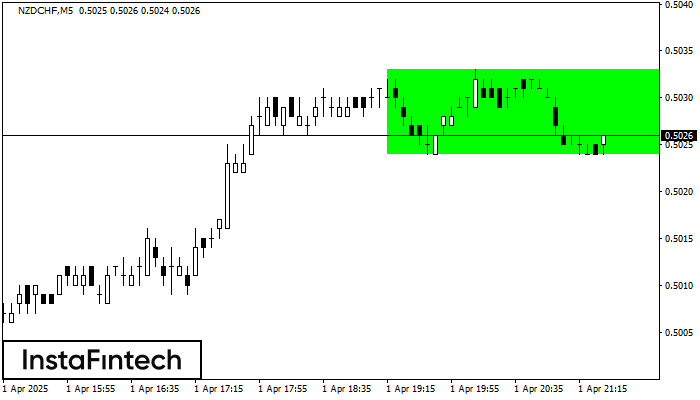
According to the chart of M5, NZDCHF formed the Bullish Rectangle. This type of a pattern indicates a trend continuation. It consists of two levels: resistance 0.5033 and support 0.5024. In case the resistance level 0.5033 - 0.5033 is broken, the instrument is likely to follow the bullish trend.
The M5 and M15 time frames may have more false entry points.
Veja também
- All
- All
- Bearish Rectangle
- Bearish Symmetrical Triangle
- Bearish Symmetrical Triangle
- Bullish Rectangle
- Double Top
- Double Top
- Triple Bottom
- Triple Bottom
- Triple Top
- Triple Top
- All
- All
- Buy
- Sale
- All
- 1
- 2
- 3
- 4
- 5
Fundo duplo
was formed on 30.04 at 15:00:30 (UTC+0)
signal strength 3 of 5
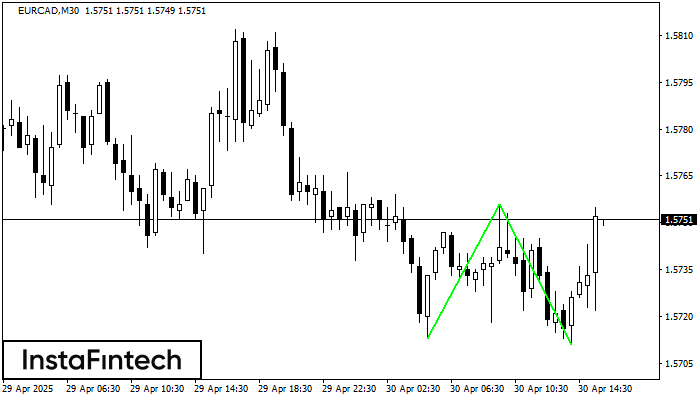
O padrão Fundo duplo foi formado em EURCAD M30. Esta formação sinaliza uma reversão da tendência de baixo para cima. O sinal é que uma negociação de compra deve
Open chart in a new window
Fundo duplo
was formed on 30.04 at 15:00:21 (UTC+0)
signal strength 4 of 5
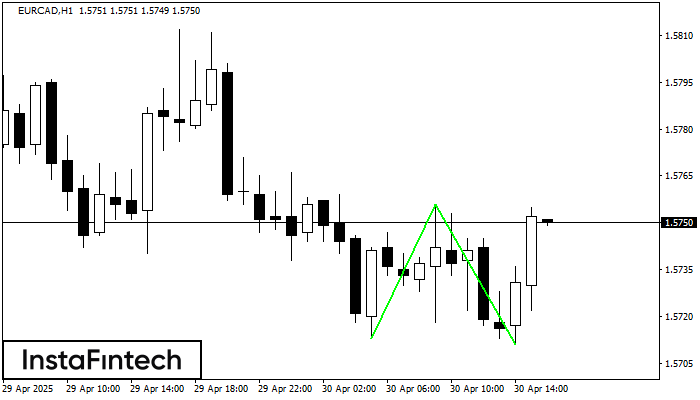
O padrão Fundo duplo foi formado em EURCAD H1. Características: o nível de suporte 1.5713; o nível de resistência 1.5756; a largura do padrão 43 pontos. Se o nível
Open chart in a new window
Topo duplo
was formed on 30.04 at 14:30:27 (UTC+0)
signal strength 2 of 5
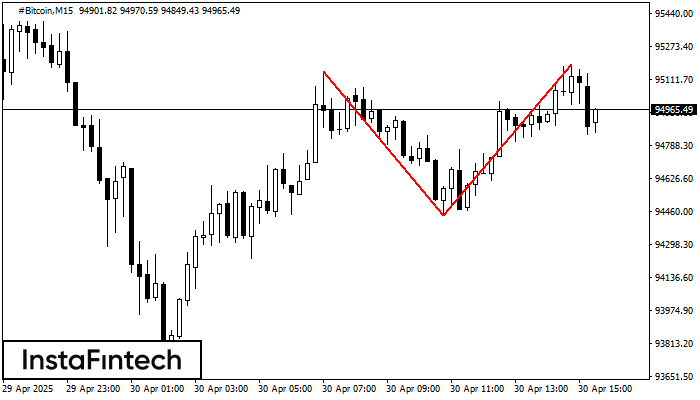
O padrão de reversão Topo duplo foi formado em #Bitcoin M15. Características: o limite superior 95150.89; o limite inferior 94442.57; a largura do padrão é de 74407 pontos. As operações
Os intervalos M5 e M15 podem ter mais pontos de entrada falsos.
Open chart in a new window