Padrões atuais

Padrões são modelos gráficos que são formados no gráfico pelo preço. Segundo um dos postulados da análise técnica, a história (movimento de preços) se repete. Isso significa que os movimentos de preços geralmente são semelhantes nas mesmas situações, o que possibilita prever o desenvolvimento futuro da situação com alta probabilidade.
Os padrões relevantes da InstaTrade são um serviço fácil de usar, que permite que você esteja ciente das últimas mudanças no mercado e reaja a indícios do mercado a tempo. Em nosso serviço, você sempre encontrará os padrões mais recentes e relevantes em qualquer par e em qualquer período gráfico.
Double Top
was formed on 11.04 at 04:00:34 (UTC+0)
signal strength 4 of 5
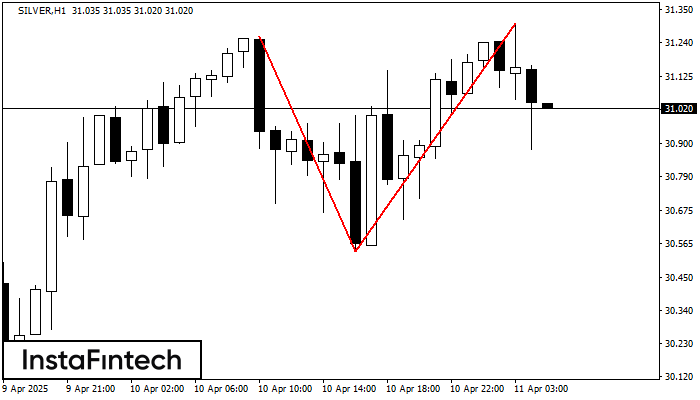
The Double Top reversal pattern has been formed on SILVER H1. Characteristics: the upper boundary 31.26; the lower boundary 30.54; the width of the pattern is 765 points. Sell trades are better to be opened below the lower boundary 30.54 with a possible movements towards the 30.50 level.
- All
- All
- Bearish Rectangle
- Bearish Symmetrical Triangle
- Bearish Symmetrical Triangle
- Bullish Rectangle
- Double Top
- Double Top
- Triple Bottom
- Triple Bottom
- Triple Top
- Triple Top
- All
- All
- Buy
- Sale
- All
- 1
- 2
- 3
- 4
- 5
Bearish Rectangle
сформирован 02.06 в 06:43:05 (UTC+0)
сила сигнала 1 из 5
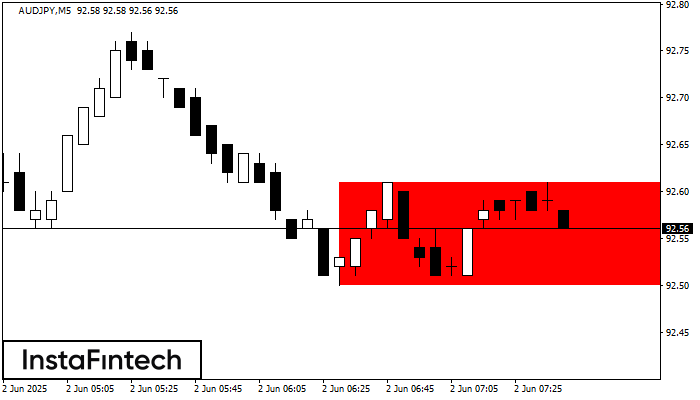
According to the chart of M5, AUDJPY formed the Bearish Rectangle. This type of a pattern indicates a trend continuation. It consists of two levels: resistance 92.61 - 0.00
The M5 and M15 time frames may have more false entry points.
Открыть график инструмента в новом окне
Double Bottom
сформирован 02.06 в 06:15:53 (UTC+0)
сила сигнала 2 из 5
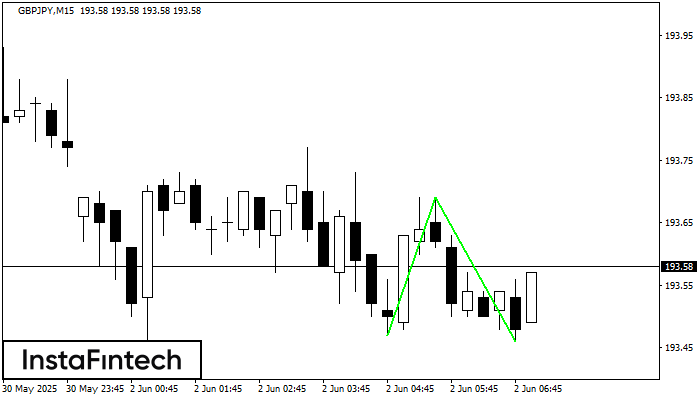
The Double Bottom pattern has been formed on GBPJPY M15. Characteristics: the support level 193.47; the resistance level 193.69; the width of the pattern 22 points. If the resistance level
The M5 and M15 time frames may have more false entry points.
Открыть график инструмента в новом окне
Bullish Rectangle
сформирован 02.06 в 06:00:14 (UTC+0)
сила сигнала 2 из 5
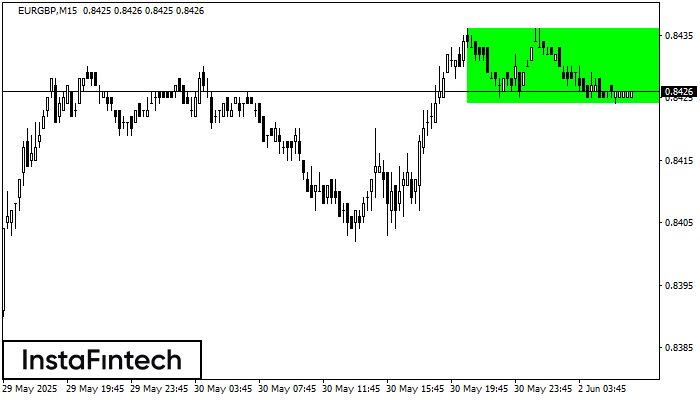
According to the chart of M15, EURGBP formed the Bullish Rectangle. This type of a pattern indicates a trend continuation. It consists of two levels: resistance 0.8436 and support 0.8424
The M5 and M15 time frames may have more false entry points.
Открыть график инструмента в новом окне