

Padrões atuais

Padrões são modelos gráficos que são formados no gráfico pelo preço. Segundo um dos postulados da análise técnica, a história (movimento de preços) se repete. Isso significa que os movimentos de preços geralmente são semelhantes nas mesmas situações, o que possibilita prever o desenvolvimento futuro da situação com alta probabilidade.
Os padrões relevantes da InstaTrade são um serviço fácil de usar, que permite que você esteja ciente das últimas mudanças no mercado e reaja a indícios do mercado a tempo. Em nosso serviço, você sempre encontrará os padrões mais recentes e relevantes em qualquer par e em qualquer período gráfico.
Triple Top
was formed on 17.04 at 17:45:29 (UTC+0)
signal strength 1 of 5

On the chart of the NZDCAD M5 trading instrument, the Triple Top pattern that signals a trend change has formed. It is possible that after formation of the third peak, the price will try to break through the resistance level 0.8255, where we advise to open a trading position for sale. Take profit is the projection of the pattern’s width, which is 17 points.
The M5 and M15 time frames may have more false entry points.
- All
- All
- Bearish Rectangle
- Bearish Symmetrical Triangle
- Bearish Symmetrical Triangle
- Bullish Rectangle
- Double Top
- Double Top
- Triple Bottom
- Triple Bottom
- Triple Top
- Triple Top
- All
- All
- Buy
- Sale
- All
- 1
- 2
- 3
- 4
- 5
Retângulo de alta
was formed on 30.04 at 10:57:58 (UTC+0)
signal strength 1 of 5
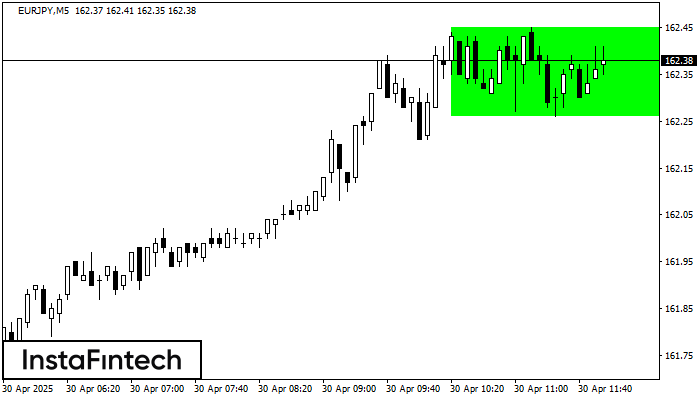
Conforme o gráfico de M5, EURJPY formou o Retângulo de alta. Este tipo de padrão indica uma continuação da tendência. Ele consiste em dois níveis: resistência 162.45 e suporte 162.26
Os intervalos M5 e M15 podem ter mais pontos de entrada falsos.
Open chart in a new window
Topo triplo
was formed on 30.04 at 10:25:27 (UTC+0)
signal strength 1 of 5
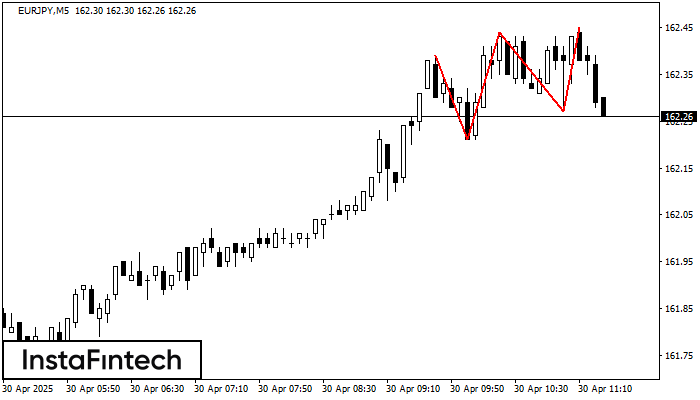
O padrão Topo triplo foi formado no gráfico do instrumento de negociação EURJPY M5. É um padrão de reversão com as seguintes características: nível de resistência -6, nível de suporte
Os intervalos M5 e M15 podem ter mais pontos de entrada falsos.
Open chart in a new window
Retângulo de baixa
was formed on 30.04 at 10:08:30 (UTC+0)
signal strength 2 of 5
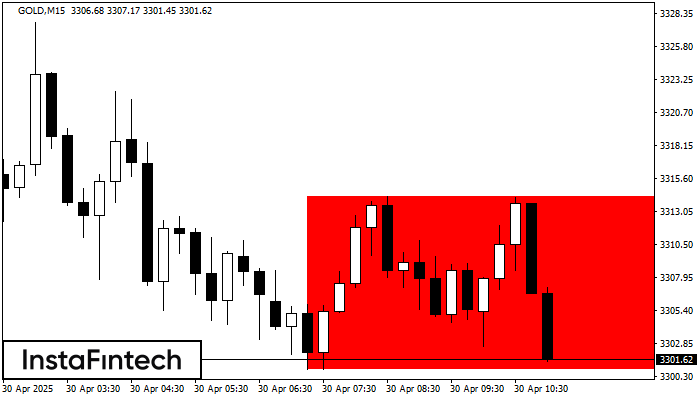
De acordo com o gráfico de M15, GOLD formou Retângulo de baixa. O padrão indica uma continuação da tendência. O limite superior é 3314.24, o limite inferior é 3300.82
Os intervalos M5 e M15 podem ter mais pontos de entrada falsos.
Open chart in a new window


