

Actual patterns

Patterns are graphical models which are formed in the chart by the price. According to one of the technical analysis postulates, history (price movement) repeats itself. It means that the price movements are often similar in the same situations which makes it possible to predict the further development of the situation with a high probability.
Relevant patterns by InstaTrade is an easy-to-use service which allows you to be aware of latest changes in the market and react to clues from the market in time. In our service you will always find the latest and most relevant patterns on any pair and any timeframe.
Triple Top
was formed on 17.04 at 17:45:29 (UTC+0)
signal strength 1 of 5

On the chart of the NZDCAD M5 trading instrument, the Triple Top pattern that signals a trend change has formed. It is possible that after formation of the third peak, the price will try to break through the resistance level 0.8255, where we advise to open a trading position for sale. Take profit is the projection of the pattern’s width, which is 17 points.
The M5 and M15 time frames may have more false entry points.
See Also
- All
- All
- Bearish Rectangle
- Bearish Symmetrical Triangle
- Bearish Symmetrical Triangle
- Bullish Rectangle
- Double Top
- Double Top
- Triple Bottom
- Triple Bottom
- Triple Top
- Triple Top
- All
- All
- Buy
- Sale
- All
- 1
- 2
- 3
- 4
- 5
Đảo đầu và vai
was formed on 30.05 at 08:00:23 (UTC+0)
signal strength 3 of 5
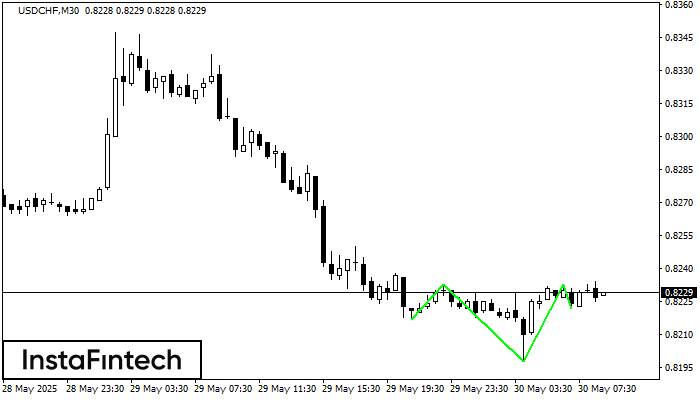
Theo M30, USDCHF đang định hình mô hình kỹ thuật - Đảo đầu và vai. Trong trường hợp Đường viền cổ 0.8233/0.8233 bị phá vỡ, công
Open chart in a new window
Đảo đầu và vai
was formed on 30.05 at 07:31:35 (UTC+0)
signal strength 3 of 5
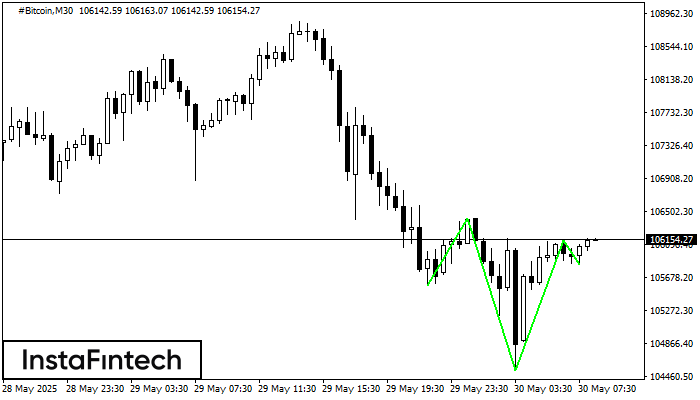
Theo M30, #Bitcoin đang định hình mô hình kỹ thuật - Đảo đầu và vai. Trong trường hợp Đường viền cổ 106415.11/106138.63 bị phá vỡ, công
Open chart in a new window
Đầu và vai
was formed on 27.05 at 01:00:01 (UTC+0)
signal strength 3 of 5
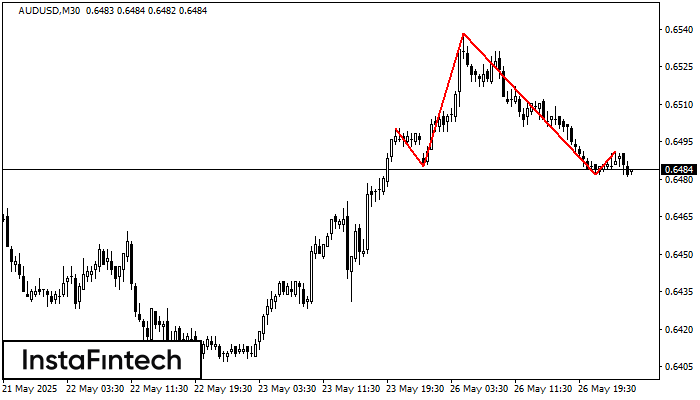
Theo biểu đồ của M30, AUDUSD đã hình thành mô hình Đầu và vai. Đỉnh của Đầu được đặt ở 0.6538 trong khi đường trung bình của Cổ được
Open chart in a new window


