Актуальные паттерны

Паттерны – это графические модели, которые "рисует" цена на графике. Один из постулатов технического анализа говорит нам о том, что история (движение цены) всегда повторяется. Это значит, что в похожих ситуациях движение цены, зачастую, будет похожим, что позволяет с высокой долей вероятности спрогнозировать дальнейшее развитие ситуации.
Актуальные паттерны от ИнстаФорекс – это удобный сервис, который позволит вам всегда быть в курсе последних изменений на рынке и вовремя реагировать на появившиеся подсказки от рынка. В нашем сервисе вы всегда найдете самые свежие и актуальные паттерны на любой паре и на любом таймфрейме.
Тройная вершина
сформирован 25.03 в 15:55:23 (UTC+0)
сила сигнала 1 из 5
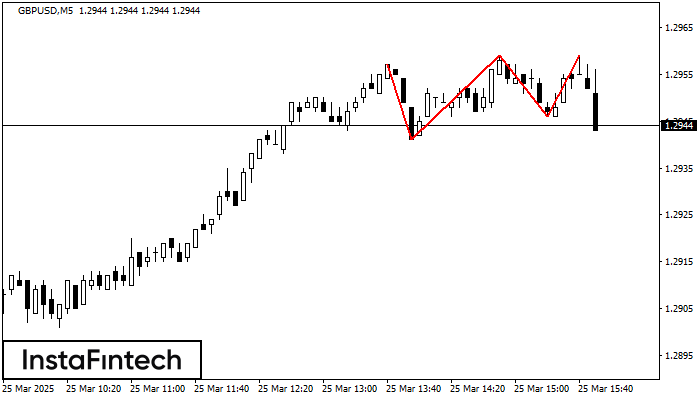
На графике GBPUSD M5 образовалась фигура «Тройная вершина», которая сигнализирует об изменении тенденции. Возможный сценарий: После формирования третьей вершины котировка постарается пробить нижнюю границу 1.2946, где трейдеру и стоило бы открывать торговую позицию на продажу. Тейк Профит - это и есть проекция ширины фигуры, которая составляет 13 пунктов.
Таймфреймы М5 и М15 могут иметь больше ложных точек входа.
Смотрите также
- Все
- Все
- Bearish Rectangle
- Bearish Symmetrical Triangle
- Bearish Symmetrical Triangle
- Bullish Rectangle
- Double Top
- Double Top
- Triple Bottom
- Triple Bottom
- Triple Top
- Triple Top
- Все
- Все
- Покупка
- Продажа
- Все
- 1
- 2
- 3
- 4
- 5
Head and Shoulders
was formed on 17.04 at 18:45:16 (UTC+0)
signal strength 2 of 5
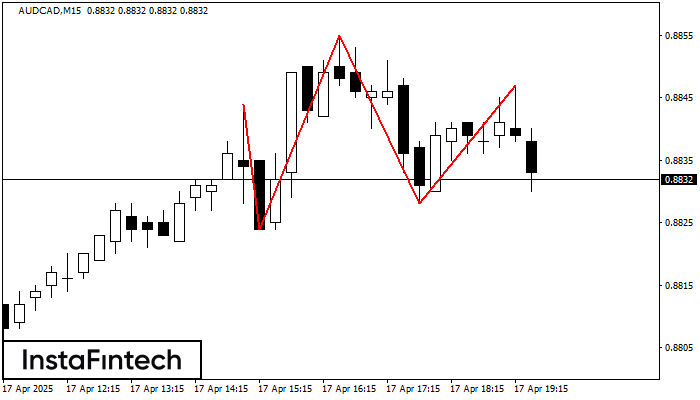
The AUDCAD M15 formed the Head and Shoulders pattern with the following features: The Head’s top is at 0.8855, the Neckline and the upward angle are at 0.8824/0.8828. The formation
The M5 and M15 time frames may have more false entry points.
Open chart in a new window
Triple Top
was formed on 17.04 at 18:45:16 (UTC+0)
signal strength 1 of 5
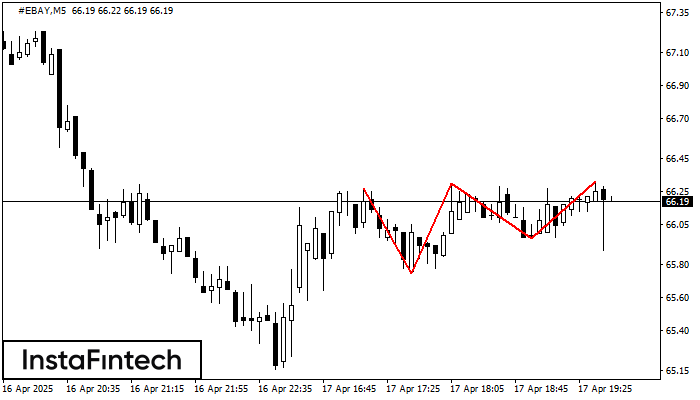
The Triple Top pattern has formed on the chart of the #EBAY M5. Features of the pattern: borders have an ascending angle; the lower line of the pattern
The M5 and M15 time frames may have more false entry points.
Open chart in a new window
Double Bottom
was formed on 17.04 at 18:45:14 (UTC+0)
signal strength 2 of 5
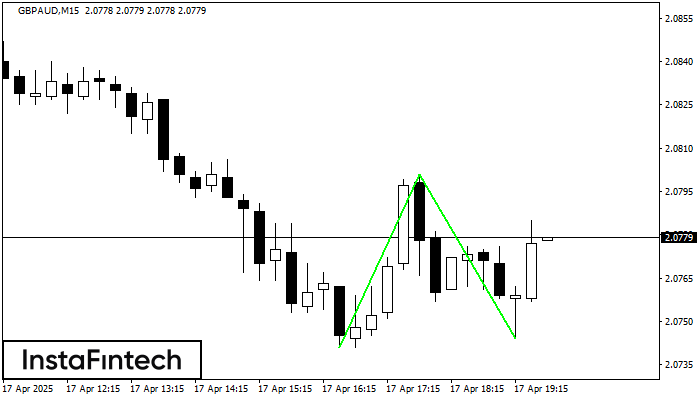
The Double Bottom pattern has been formed on GBPAUD M15; the upper boundary is 2.0801; the lower boundary is 2.0744. The width of the pattern is 60 points. In case
The M5 and M15 time frames may have more false entry points.
Open chart in a new window