Актуальные паттерны

Паттерны – это графические модели, которые "рисует" цена на графике. Один из постулатов технического анализа говорит нам о том, что история (движение цены) всегда повторяется. Это значит, что в похожих ситуациях движение цены, зачастую, будет похожим, что позволяет с высокой долей вероятности спрогнозировать дальнейшее развитие ситуации.
Актуальные паттерны от ИнстаФорекс – это удобный сервис, который позволит вам всегда быть в курсе последних изменений на рынке и вовремя реагировать на появившиеся подсказки от рынка. В нашем сервисе вы всегда найдете самые свежие и актуальные паттерны на любой паре и на любом таймфрейме.
Бычий симметричный треугольник
сформирован 17.04 в 03:06:49 (UTC+0)
сила сигнала 3 из 5

По EURNZD на M30 фигура «Бычий симметричный треугольник». Характеристика: Фигура продолжения тренда; Координаты границ – верхняя 1.9252, нижняя 1.9161. Проекция ширины фигуры 91 пунктов. Прогноз: В случае пробоя верхней границы 1.9252 цена, вероятнее всего, продолжит движение к 1.9237.
- Все
- Все
- Bearish Rectangle
- Bearish Symmetrical Triangle
- Bearish Symmetrical Triangle
- Bullish Rectangle
- Double Top
- Double Top
- Triple Bottom
- Triple Bottom
- Triple Top
- Triple Top
- Все
- Все
- Покупка
- Продажа
- Все
- 1
- 2
- 3
- 4
- 5
Bullish pennant
was formed on 29.05 at 22:16:23 (UTC+0)
signal strength 3 of 5
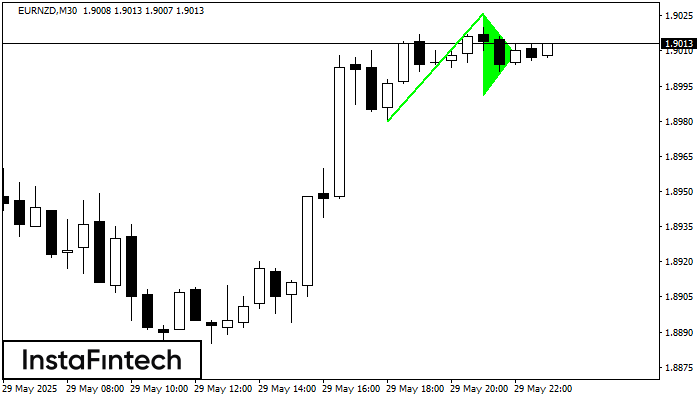
The Bullish pennant graphic pattern has formed on the EURNZD M30 instrument. This pattern type falls under the category of continuation patterns. In this case, if the quote can breaks
Open chart in a new window
Bearish pennant
was formed on 27.05 at 19:34:18 (UTC+0)
signal strength 3 of 5
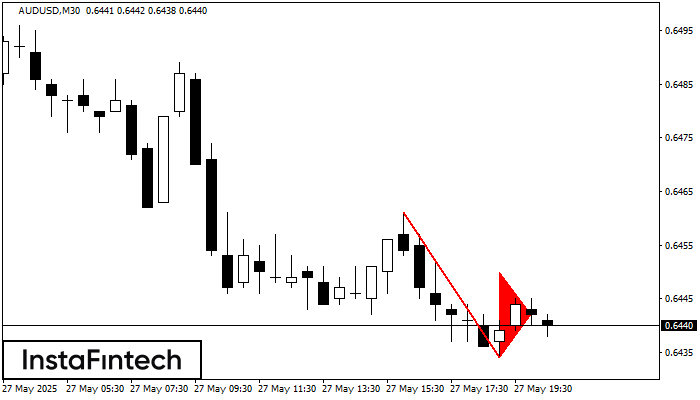
The Bearish pennant pattern has formed on the AUDUSD M30 chart. This pattern type is characterized by a slight slowdown after which the price will move in the direction
Open chart in a new window
Bearish pennant
was formed on 27.05 at 04:02:54 (UTC+0)
signal strength 3 of 5
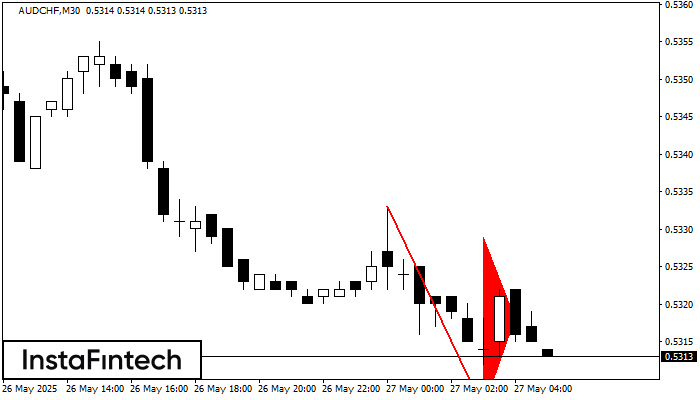
The Bearish pennant pattern has formed on the AUDCHF M30 chart. It signals potential continuation of the existing trend. Specifications: the pattern’s bottom has the coordinate of 0.5306; the projection
Open chart in a new window