See also


The "Head and Shoulders" pattern is primarily a reversal pattern. This pattern is formed on the basis of 3 tops or 3 bottoms, moreover the middle top(bottom) higher than the other two.
As a rule, novice traders are trying to find the popular Head And Shoulders pattern on trading charts. This model is described in almost all books on currency trading, experts write research papers about it, read lectures, etc. However, despite of the fact that this model is very popular, most traders identify it completely wrong and do not know how to apply it in trading.
Head and Shoulders is a trend reversal pattern. In other words, if you see this pattern, then after it is finally formed, the main trend, as a rule, partially or completely reverses. It means that the Head and Shoulders pattern is formed at highs or lows.
This pattern is formed on the basis of 3 peaks or 3 troughs.
The reversal Head and Shoulders pattern is formed by 3 peaks, where the middle peak is higher than the other two. The right minimum of the middle peak (head) is located slightly higher than the left minimum of the peak. In other words, the neckline of the Head and Shoulders pattern should be slightly higher on the left side. Despite the fact that this condition is ideal for this model, there are cases when the neckline is horizontal, and sometimes even slightly inclined to the left side. These models also work, but the probability of failure is noticeably higher than for the standard Head and Shoulder patterns.
Let's analyze when it is the best time to enter and exit the market on the grounds of the Head and Shoulders pattern. As a rule, a break of the neckline is a clear sign to sell. In other words, closing the candle below the neckline is a signal to sell.
Our minimum target for take-profit is proportional to the distance from the middle peak (head) to the neckline. However, such reversal patterns quite often can yield a profit greater than the given distance. Therefore, when the set level of take profit is achieved, the best option is to close the deal partly and set the rest of the deal to a trailing stop or calculate new targets, for example, using the Fibonacci retracements.
Stop-loss must be set at least above the right shoulder for sell deals. In addition, the volume of trade is very important in the Head and Shoulders pattern.

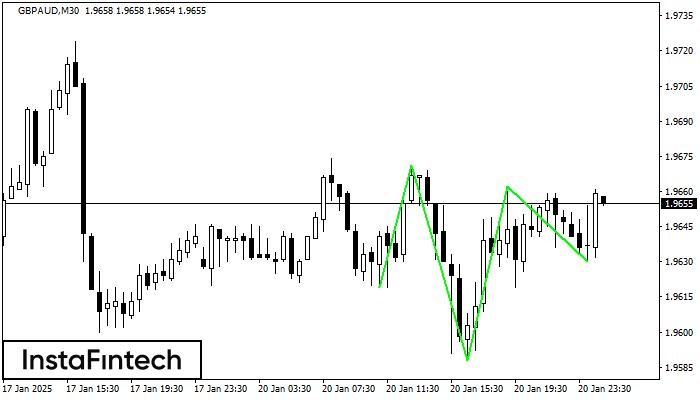
According to M30, GBPAUD is shaping the technical pattern – the Inverse Head and Shoulder. In case the Neckline 1.9671/1.9662 is broken out, the instrument is likely to move toward
Open chart in a new window

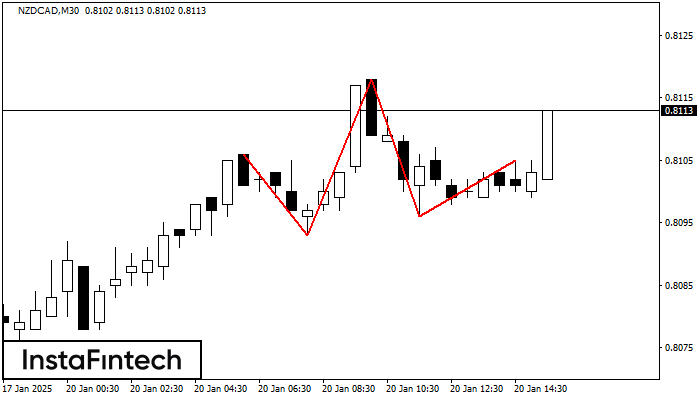
The technical pattern called Head and Shoulders has appeared on the chart of NZDCAD M30. There are weighty reasons to suggest that the price will surpass the Neckline 0.8093/0.8096 after
Open chart in a new window

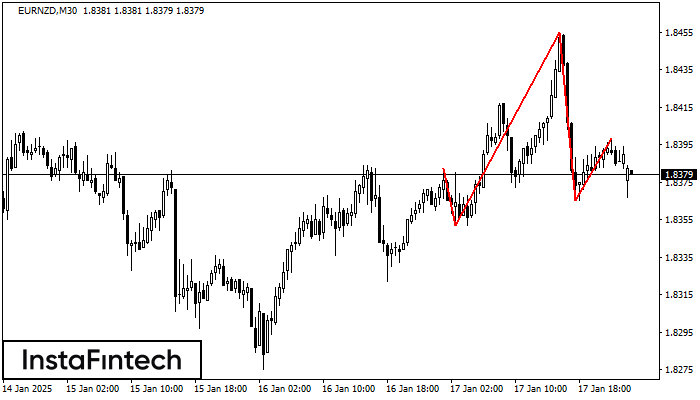
According to the chart of M30, EURNZD formed the Head and Shoulders pattern. The Head’s top is set at 1.8455 while the median line of the Neck is found
Open chart in a new windowTraining video

Your IP address shows that you are currently located in the USA. If you are a resident of the United States, you are prohibited from using the services of InstaFintech Group including online trading, online transfers, deposit/withdrawal of funds, etc.
If you think you are seeing this message by mistake and your location is not the US, kindly proceed to the website. Otherwise, you must leave the website in order to comply with government restrictions.
Why does your IP address show your location as the USA?
Please confirm whether you are a US resident or not by clicking the relevant button below. If you choose the wrong option, being a US resident, you will not be able to open an account with InstaTrade anyway.
We are sorry for any inconvenience caused by this message.
