Patrones actuales

Los patrones son modelos gráficos que se forman en el gráfico mediante el precio. Según uno de los postulados del análisis técnico, la historia (movimiento del precio) se repite. Esto quiere decir que los movimientos del precio a menudo son similares en las mismas situaciones que hacen posible pronosticar el futuro desarrollo de la situación con una alta probabilidad.
Los patrones relevantes de InstaTrade son un servicio fácil de utilizar que permiten que conozca los últimos cambios en el mercado y reaccione a las pistas del mercado a tiempo. En nuestro servicio, siempre encontrará los últimos y más importantes patrones en cualquier par y en cualquier marco de tiempo.
Bearish Symmetrical Triangle
was formed on 25.03 at 17:08:26 (UTC+0)
signal strength 1 of 5
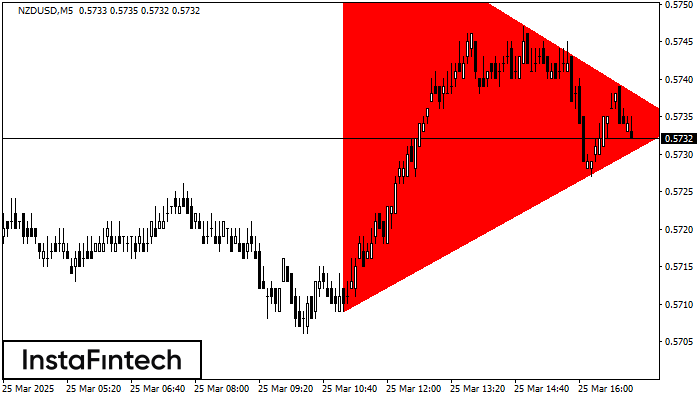
According to the chart of M5, NZDUSD formed the Bearish Symmetrical Triangle pattern. Trading recommendations: A breach of the lower border 0.5709 is likely to encourage a continuation of the downward trend.
The M5 and M15 time frames may have more false entry points.
Vea asimismo
- All
- All
- Bearish Rectangle
- Bearish Symmetrical Triangle
- Bearish Symmetrical Triangle
- Bullish Rectangle
- Double Top
- Double Top
- Triple Bottom
- Triple Bottom
- Triple Top
- Triple Top
- All
- All
- Buy
- Sale
- All
- 1
- 2
- 3
- 4
- 5
Cabeza y Hombros Inverso
was formed on 30.04 at 09:15:30 (UTC+0)
signal strength 1 of 5
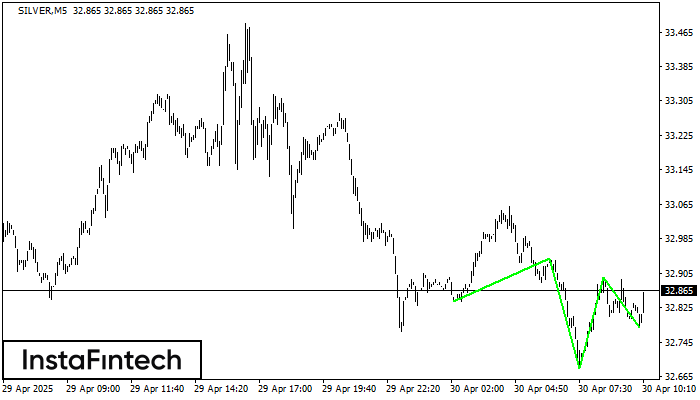
Según M5, SILVER está formando el patrón técnico: el Cabeza y Hombros Inverso. En caso de que la línea de cuello 32.94/32.90 se rompa, es posible que el instrumento
Los marcos de tiempo M5 y M15 pueden tener más puntos de entrada falsos.
Open chart in a new window
Triángulo Simétrico Alcista
was formed on 30.04 at 09:01:33 (UTC+0)
signal strength 4 of 5
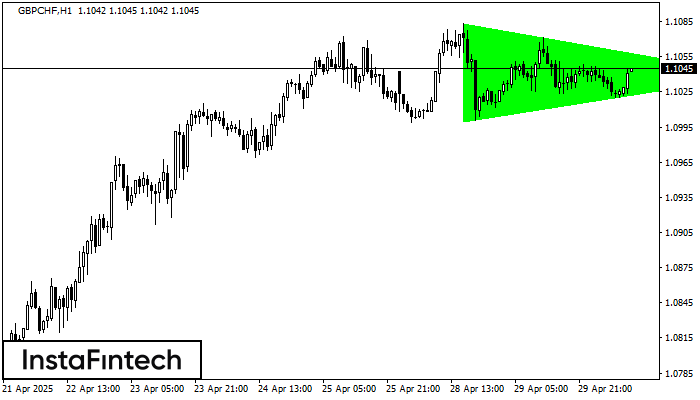
Según el gráfico de H1, GBPCHF formó el patrón Triángulo Simétrico Alcista. Descripción: Este es el patrón de la continuación de una tendencia. 1.1083 y 1.0999 son las coordenadas
Open chart in a new window
Doble Piso
was formed on 30.04 at 09:00:23 (UTC+0)
signal strength 3 of 5
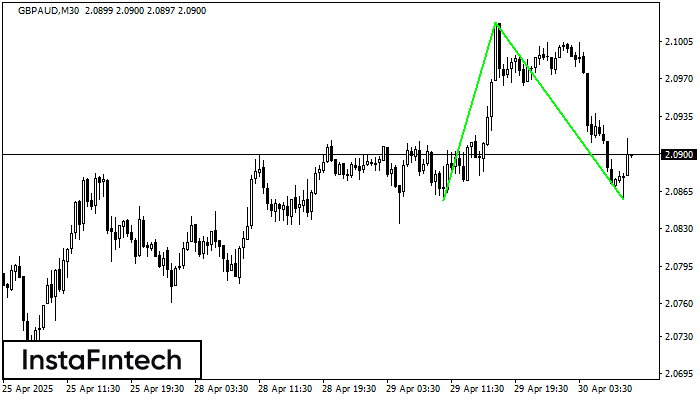
El patrón Doble Piso ha sido formado en GBPAUD M30; el límite superior es 2.1023; el límite inferior es 2.0858. El ancho del patrón es 166 puntos. En caso
Open chart in a new window