

Patrones actuales

Los patrones son modelos gráficos que se forman en el gráfico mediante el precio. Según uno de los postulados del análisis técnico, la historia (movimiento del precio) se repite. Esto quiere decir que los movimientos del precio a menudo son similares en las mismas situaciones que hacen posible pronosticar el futuro desarrollo de la situación con una alta probabilidad.
Los patrones relevantes de InstaTrade son un servicio fácil de utilizar que permiten que conozca los últimos cambios en el mercado y reaccione a las pistas del mercado a tiempo. En nuestro servicio, siempre encontrará los últimos y más importantes patrones en cualquier par y en cualquier marco de tiempo.
Head and Shoulders
was formed on 07.04 at 16:09:55 (UTC+0)
signal strength 1 of 5

According to the chart of M5, AUDCAD formed the Head and Shoulders pattern. The Head’s top is set at 0.8678 while the median line of the Neck is found at 0.8595/0.8604. The formation of the Head and Shoulders pattern evidently signals a reversal of the upward trend. In other words, in case the scenario comes true, the price of AUDCAD will go towards 0.8589.
The M5 and M15 time frames may have more false entry points.
Vea asimismo
- All
- All
- Bearish Rectangle
- Bearish Symmetrical Triangle
- Bearish Symmetrical Triangle
- Bullish Rectangle
- Double Top
- Double Top
- Triple Bottom
- Triple Bottom
- Triple Top
- Triple Top
- All
- All
- Buy
- Sale
- All
- 1
- 2
- 3
- 4
- 5
Triángulo Simétrico Bajista
was formed on 30.04 at 15:41:07 (UTC+0)
signal strength 5 of 5
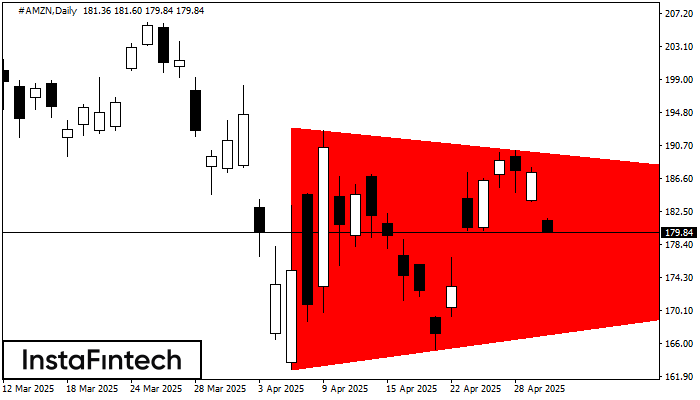
Según el gráfico de D1, el #AMZN formó el patrón Triángulo Simétrico Bajista. Este patrón señala una tendencia bajista en caso de que el límite inferior 162.77 sea roto. Aquí
Open chart in a new window
Doble Techo
was formed on 30.04 at 15:30:25 (UTC+0)
signal strength 3 of 5
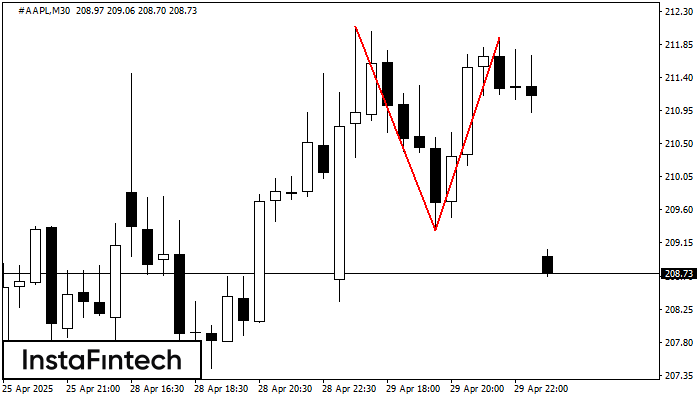
El patrón Doble Techo ha sido formado en #AAPL M30. Esto señala que la tendencia ha sido cambiada de alcista a bajista. Probablemente, si la base del patrón 209.32
Open chart in a new window
Doble Techo
was formed on 30.04 at 15:30:24 (UTC+0)
signal strength 4 of 5
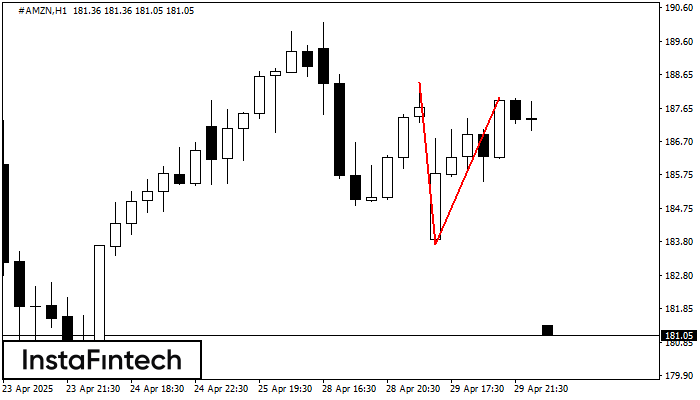
El patrón de reversión Doble Techo ha sido formado en #AMZN H1. Características: el límite superior 188.42; el límite inferior 183.71; el ancho del patrón es 426 puntos. Es mejor
Open chart in a new window


