อ่านรายละเอียดเพิ่มเติม


 14.04.2023 12:52 AM
Overview :
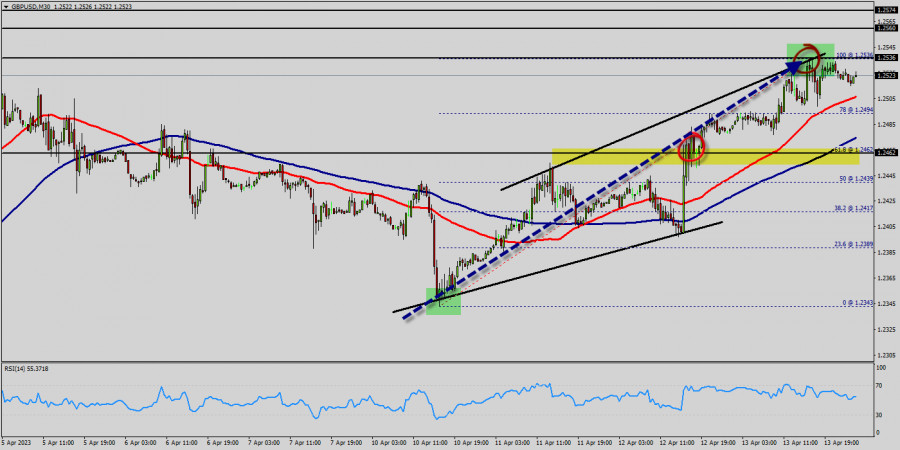
The GBPUSD pair traded with strong positivity yesterday to return to the bullish channel that appears on the chart, to head towards achieving expected additional gains in the upcoming sessions, targeting visiting 1.2522 level mainly. Therefore, we expect to witness more bullish bias in the upcoming sessions, noting that breaking 1.2462 and holding above it will stop the positive scenario and push the price to decline again.
The expected trading range for today is between 1.2462 support and 1.2560 resistance. The GBP/USD pair is going to continue to rise from the level of 1.2462 in the long term.
It should be noted that the support is established at the level of 1.2462 which represents the 61.8% Fibonacci retracement level on the M30 chart. The price is likely to form a double bottom in the same time frame. Accordingly, the GBP/USD pair is showing signs of strength following a breakout of the highest level of 1.2462.
So, buy above the level of 1.2462 with the first target at 1.2536 in order to test the daily resistance 1; and further to 1.2560.
Also, it might be noted that the level of 1.2560 is a good place to take profit because it will form a double top. The price is in a bullish channel now. In the Forex market, liquidity pertains to a currency pair's ability to be bought and sold at the current market price. Additionally, liquidity refers to market volatility and dynamics. Because the Forex market is colossal, it is also extremely liquid. Moreover, if a currency pair has high level of liquidity, it will be easier to trade.
On the other hand, in case a reversal takes place and the GBP/USD pair breaks through the support level of 1.2462, a further decline to 1.2343 can occur which would indicate a bearish market.
Trading recommendations :
The trend is still bullish as long as the price of 1.2463 is not broken. Thereupon, it would be wise to buy above the price of at 1.2463 with the primary target at 1.2536. Then, the GBP/USD pair will continue towards the second target at 1.2560.
In technical analysis: history usually repeats itself at certain level. So it will be of the wisdom to use historic rates to determine future prices. The technical analysis based only on the technical market data (quotes) with the help of various technical indicators. Moreover, in this book we will be touching on a variety of new techniques for applying numerical strategies, equations, formulas and probabilities. Additionally, we will be shared some of classical analysis such as breakout strategy and trend indicators. Alternative scenario : The breakdown of 1.2463 will allow the pair to go further down to the prices of 1.2403 and 1.2343.
You have already liked this post today
*บทวิเคราะห์ในตลาดที่มีการโพสต์ตรงนี้ เพียงเพื่อทำให้คุณทราบถึงข้อมูล ไม่ได้เป็นการเจาะจงถึงขั้นตอนให้คุณทำการซื้อขายตาม
ราคาน้ำมันดิบสหรัฐฯ West Texas Intermediate (WTI) มีการรวมตัวใกล้จุดสูงสุดของเดือน หยุดการเพิ่มต่อเนื่องสี่วัน แต่อย่างไรก็ตาม การปรับตัวลงในวันซื้อขายไม่เป็นไปในทางขาลงอย่างชัดเจน ราคาของ WTI รวมตัวอยู่ใกล้จุดสูงสุดของเดือน โดยมีการหยุดการเพิ่มขึ้นต่อเนื่องสี่วัน ถึงกระนั้น การปรับตัวลงระหว่างวันไม่แสดงถึงความเชื่อมั่นที่จะไปทางขาลงอย่างชัดเจน
บนกราฟรายชั่วโมง คู่สกุลเงิน GBP/USD ยังคงเคลื่อนที่ขึ้นในวันอังคาร หลังจากดีดตัวจากระดับ 1.3139 มองจากโครงสร้างคลื่นแล้ว แนวโน้มขาลงยังไม่ได้ถูกทำลายอย่างเป็นทางการ แต่ก็ใกล้จะขาดผังแล้ว การเติบโตอาจดำเนินต่อไปยังโซนแนวต้านที่ระดับ 1.3344-1.3357 การดีดตัวจากโซนนี้จะส่งผลดีต่อดอลลาร์สหรัฐฯ แต่ในกรณีนั้น แนวโน้มขาลงจะถือว่าได้รับการทำลายแล้ว การแตกทะลุและยืนเหนือพื้นที่
ลิงก์ที่มีประโยชน์: บทความอื่น ๆ ของฉันมีอยู่ในส่วนนี้ คอร์ส InstaForex สำหรับผู้เริ่มต้น การวิเคราะห์ยอดนิยม เปิดบัญชีซื้อขาย สำคัญ: ผู้เริ่มต้นในการเทรดฟอเร็กซ์จำเป็นต้องระมัดระวังอย่างมากในการตัดสินใจเกี่ยวกับการเข้าตลาด ก่อนที่รายงานสำคัญจะออกมา ควรหลีกเลี่ยงการเข้าตลาดเพื่อป้องกันไม่ให้ถูกกระทบจากการผันผวนของตลาดที่เกิดขึ้นเฉียบพลัน หากคุณตัดสินใจที่จะเทรดในช่วงที่ข่าวออกแล้ว อย่าลืมวางคำสั่งหยุดการขาดทุนเพื่อที่จะลดการสูญเสีย
แม้ว่าในกรอบเวลา 4 ชั่วโมง คู่สกุลเงิน AUD/JPY ยังคงเคลื่อนที่อยู่เหนือเส้น WMA (30 Shift 2) ซึ่งมีแนวโน้มที่สูงขึ้น แต่ด้วยเพราะดัชนี Stochastic Oscillator อยู่เหนือระดับ
จากสิ่งที่เห็นในกราฟ 4 ชั่วโมงของเครื่องมือสินค้าพลังงานน้ำมันดิบปรากฏข้อสังเกตที่น่าสนใจหลายประการ ประการแรกคือการเกิดรูปแบบ Double Bottom ที่ตามมาด้วยการบรรจบกันระหว่างการเคลื่อนไหวของราคา #CL และตัวบ่งชี้ Stochastic Oscillator ประการที่สอง คือการปรากฏของรูปแบบ Bullish Dragon
ในวันอังคาร ยูโรเลือกที่จะไม่ต่อต้านอารมณ์ของตลาดต่อไปและเข้าร่วมกับแนวโน้มที่เปิดรับความเสี่ยงมากขึ้น ดัชนีหุ้นสหรัฐ S&P 500 เพิ่มขึ้น 0.72% ดัชนีดอลลาร์ลดลง 0.76% และค่าเงินยูโรแข็งค่าขึ้น 0.88% (99 จุด) ยูโรยังได้รับแรงหนุนจากข้อมูลความเชื่อมั่นทางเศรษฐกิจ
ท่ามกลางการเพิ่มขึ้นของการรับความเสี่ยงและความเชื่อมั่นในตลาดทั่วไปเมื่อวานนี้ (S&P 500 +0.72%, WTI +2.78%, Dollar Index -0.76%) เงินปอนด์อังกฤษไม่ได้พยายามทดสอบแนวรับที่ระดับเป้าหมายที่ 1.3101 แต่กลับเคลื่อนไหวขึ้นไปและถึงระดับแนวต้านที่ 1.3311 แทน เช้าวันนี้
ดอลลาร์ออสเตรเลียได้เบรกขึ้นเหนือกรอบ 0.6394–0.6444 เส้นสัญญาณของ Marlin oscillator ได้กลับทิศทางขึ้นก่อนที่จะถึงขอบเขตของโซนขาลง เมื่อพิจารณาถึงความผันผวนที่เป็นไปได้ การอนุญาตให้ oscillator ทดสอบขอบเขตนั้นจึงเป็นไปได้ ราคาในขณะนี้มุ่งมั่นเป้าหมายสำคัญที่กรอบ 0.6640/95 อย่างมั่นใจ ในกราฟ
ในช่วงต้นของตลาดอเมริกา ทองคำกำลังซื้อขายอยู่ราว 3,249 ฟื้นตัวหลังจากที่ได้แตะจุดต่ำสุดที่ 3,224 ซึ่งใกล้เคียงกับ 200 EMA หลังจากการลงไปถึงจุดต่ำสุดนี้ ทองคำกำลังฟื้นตัวกลับมาอย่างมั่นใจ ขณะนี้ถึงระดับสูงสุดของช่องขาลงแล้ว หากทะลุผ่านได้อย่างเด็ดขาด ทองคำคาดว่าจะขึ้นต่อไป ถ้าหากทองคำทะลุและยืนอยู่เหนือ 3,250
 InstaFutures
Make money with a new promising instrument!
วิดีโอแนะนำการฝึก

Your IP address shows that you are currently located in the USA. If you are a resident of the United States, you are prohibited from using the services of InstaFintech Group including online trading, online transfers, deposit/withdrawal of funds, etc.
If you think you are seeing this message by mistake and your location is not the US, kindly proceed to the website. Otherwise, you must leave the website in order to comply with government restrictions.
Why does your IP address show your location as the USA?
Please confirm whether you are a US resident or not by clicking the relevant button below. If you choose the wrong option, being a US resident, you will not be able to open an account with InstaTrade anyway.
We are sorry for any inconvenience caused by this message.

