อ่านรายละเอียดเพิ่มเติม


 11.11.2024 12:31 PM
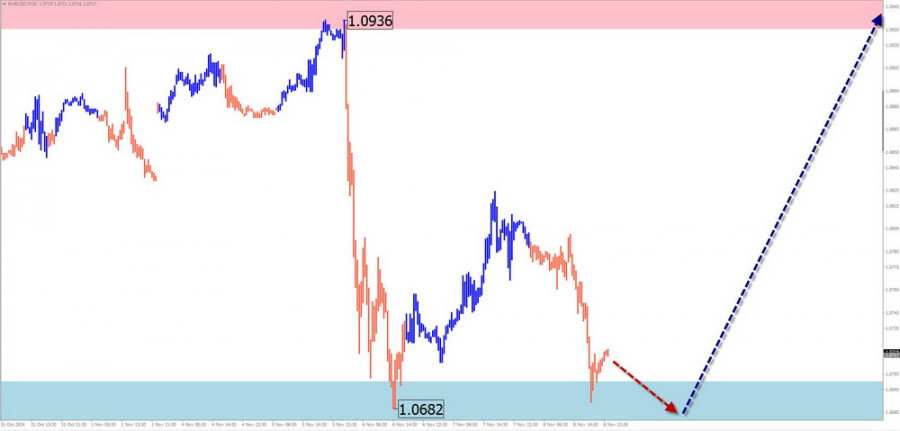
Analysis: The short-term wave structure is downward, representing a correction within the primary trend. This wave started in late August and remains incomplete. While the structure appears mature, no signals of an imminent reversal are currently observed. The price has reached the upper boundary of the preliminary target zone for the current wave.
Forecast: The euro is expected to move sideways during the upcoming week. Temporary pressure near the support level may occur in the next couple of days. A potential reversal and growth toward the lower boundary of the resistance zone could follow. An increase in volatility is likely in the latter half of the week.
Potential Reversal Zones:
Recommendations:
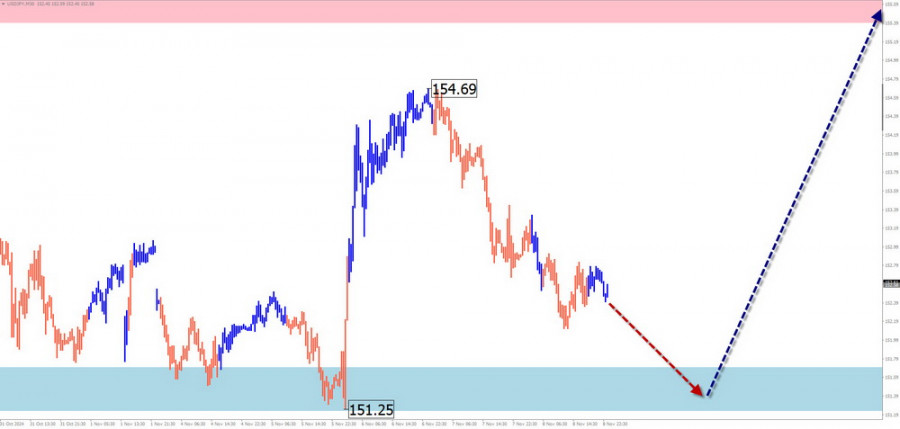
Analysis: The weakening of the yen against the U.S. dollar has been evident since early August. The pair has reached a potential reversal zone on the weekly timeframe. The corrective wave, initiated in early October, remains incomplete. The downward movement starting November 6 concludes the correction but has not fully completed at the time of analysis.
Forecast: Further decline is likely early in the week, followed by sideways movement near the support zone. A reversal and resumption of price growth are expected later in the week, with the upward movement constrained by calculated resistance levels.
Potential Reversal Zones:
Recommendations:
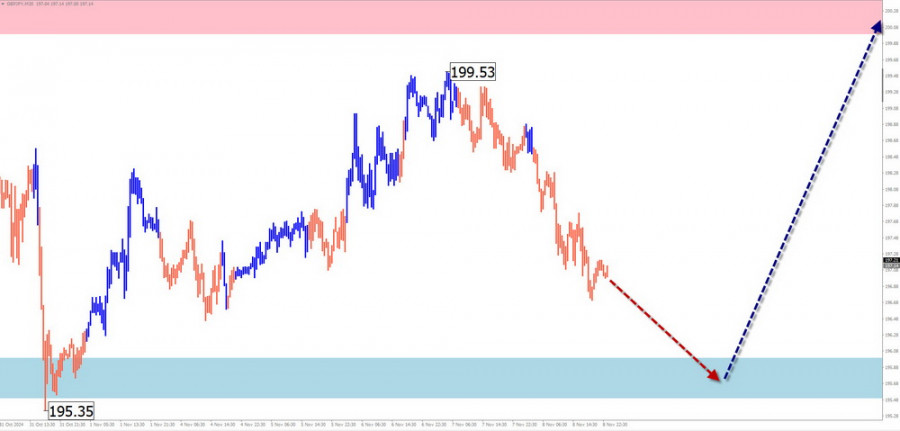
Analysis: The short-term chart for GBP/JPY shows a dominant upward trend over the past few months. The current wave segment, which began on September 11, remains incomplete. Over the past three weeks, the pair has formed a horizontal correction (Wave B), which has not yet concluded.
Forecast: Sideways movement with a downward bias is likely during the early part of the week, potentially testing the lower boundary of the support zone. A reversal and subsequent price growth are expected later in the week, potentially reaching the resistance zone.
Potential Reversal Zones:
Recommendations:
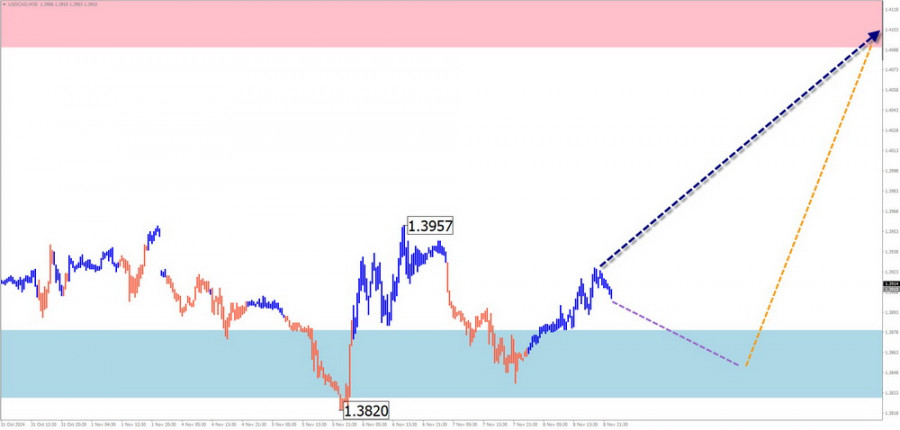
Analysis: USD/CAD continues to develop an upward wave that began in September. The counter-trend wave from November 6 is corrective and lacks reversal potential. This segment of the wave remains incomplete and coincides with the potential reversal zone on the daily timeframe.
Forecast: Sideways movement is expected for the next few days, with potential reversal conditions forming near the support zone. A directional change is likely by the weekend, with resistance levels indicating the upper boundary of the anticipated weekly range.
Potential Reversal Zones:
Recommendations:
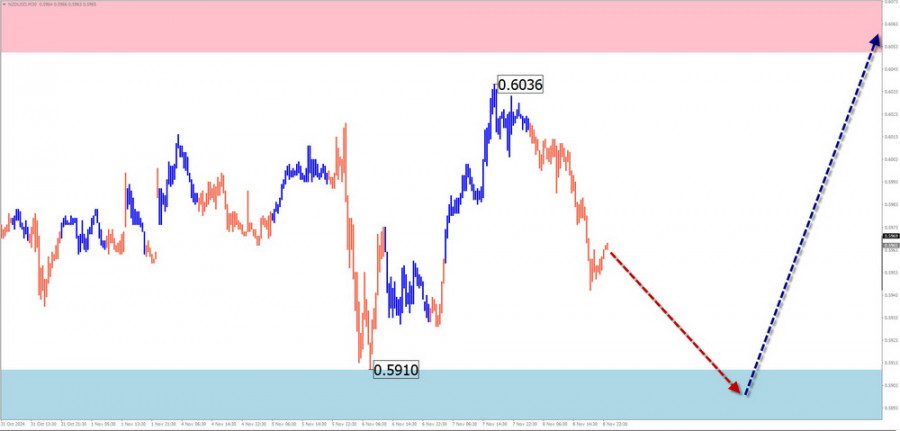
Analysis: Since late August, the NZD/USD chart has displayed a downward horizontal wave structure resembling an extended flat. The wave remains incomplete, and the price is approaching the upper boundary of the weekly potential reversal zone.
Forecast: The downward trajectory is likely to continue this week, with sideways consolidation possible early in the week. A reversal and increased volatility are expected near the calculated support zone, with potential penetration of the lower boundary.
Potential Reversal Zones:
Recommendations:
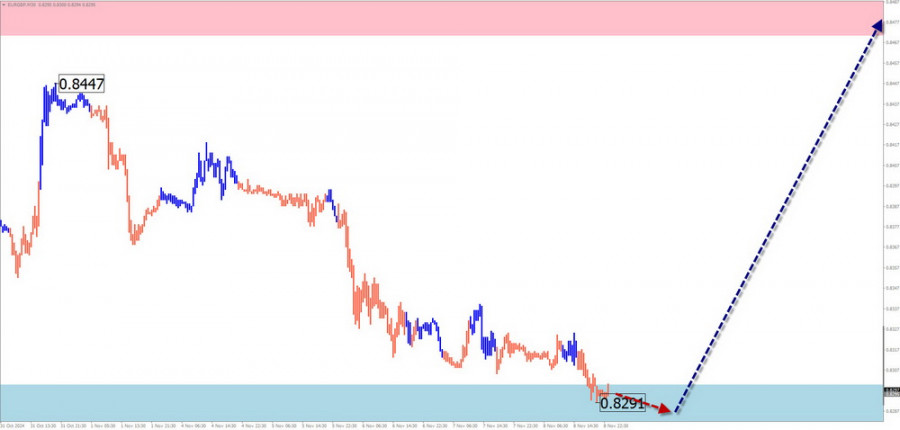
Analysis: The incomplete wave structure for EUR/GBP has been downward since August 5, forming the final segment of Wave C. The wave structure is not yet complete, and the pair has reached the upper limit of the weekly potential reversal zone.
Forecast: Sideways movement is expected over the next few days. A direct break below the support zone is unlikely. Toward the end of the week, increased volatility may signal a reversal and the start of upward movement.
Potential Reversal Zones:
Recommendations:
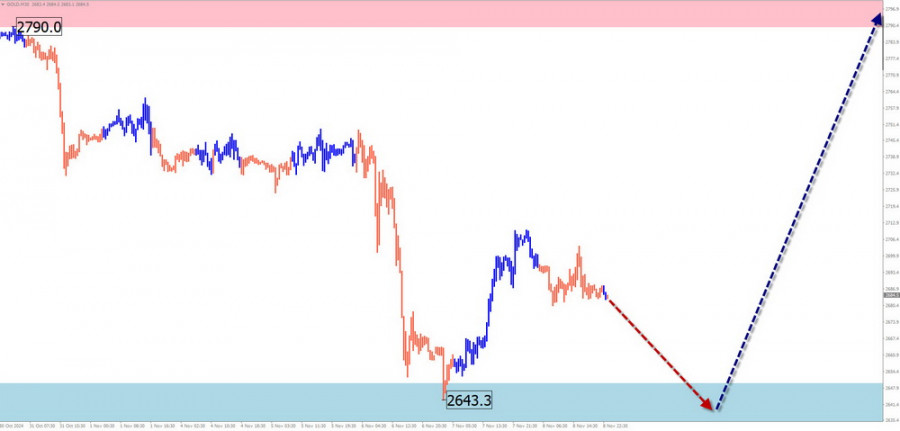
Analysis: The current wave structure for gold is upward, starting on October 3. Over the past three weeks, a horizontal correction (Wave B) has developed near strong resistance, which remains incomplete at the time of analysis.
Forecast: The downward movement is expected to conclude in the next few days, with sideways consolidation forming near the support zone. Price growth is likely to resume by the end of the week, with resistance levels indicating the upper boundary of the weekly range.
Potential Reversal Zones:
Recommendations:
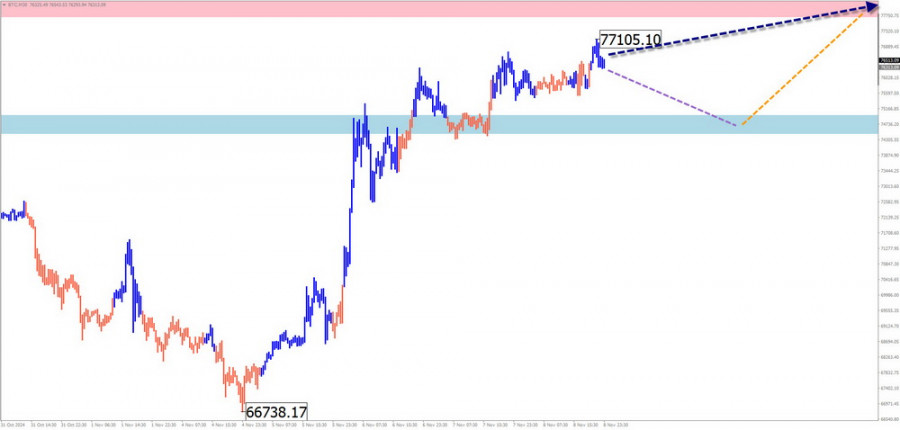
Analysis: Bitcoin's ongoing upward wave structure has been developing since August 5, indicating the start of another segment of the bullish trend. The price has reached the lower boundary of the weekly potential reversal zone.
Forecast: Bitcoin is expected to continue rising over the next few days, potentially testing the calculated resistance levels. A breakout beyond the upper boundary is unlikely. By the end of the week, increased volatility may lead to a reversal and renewed downward movement.
Potential Reversal Zones:
Recommendations:
Note: Simplified Wave Analysis (SWA) interprets waves as consisting of three parts (A-B-C). The analysis focuses on the most recent incomplete wave on each timeframe. Dotted lines indicate expected movements.
Disclaimer: Wave algorithms do not account for the duration of movements over time.
You have already liked this post today
*บทวิเคราะห์ในตลาดที่มีการโพสต์ตรงนี้ เพียงเพื่อทำให้คุณทราบถึงข้อมูล ไม่ได้เป็นการเจาะจงถึงขั้นตอนให้คุณทำการซื้อขายตาม
โครงสร้างคลื่นสำหรับ GBP/USD ยังคงบ่งชี้ถึงการพัฒนาของรูปแบบคลื่นกระจุยขึ้น โครงสร้างคลื่นแทบจะเหมือนกับ EUR/USD จนถึงวันที่ 28 กุมภาพันธ์ เราสังเกตเห็นการก่อตัวของโครงสร้างการแก้ไขที่น่าเชื่อถือ ซึ่งไม่มีข้อสงสัยมากนัก อย่างไรก็ตาม ความต้องการในเงินดอลลาร์สหรัฐฯ เริ่มลดลงอย่างรุนแรง ทำให้เกิดการกลับแนวโน้ม คลื่น
รูปแบบคลื่นในกราฟ 4 ชั่วโมงสำหรับ EUR/USD ได้เปลี่ยนเป็นโครงสร้างขาขึ้นและยังคงเป็นเช่นนั้น ชัดเจนว่าการเปลี่ยนแปลงนี้เกิดขึ้นเพียงเพราะนโยบายการค้าใหม่ของสหรัฐฯ ก่อนวันที่ 28 กุมภาพันธ์ เมื่อดอลลาร์สหรัฐเริ่มลดลงอย่างรวดเร็ว รูปแบบคลื่นเป็นแนวโน้มขาลงที่น่าเชื่อถือที่กำลังสร้างคลื่นการปรับปรุงตัวที่ 2 อย่างไรก็ตาม การประกาศรายสัปดาห์ของ Donald
โครงสร้างคลื่นสำหรับคู่สกุล GBP/USD ยังคงบ่งบอกถึงการสร้างรูปแบบคลื่นแรงกระตุ้นหุ้มตาขึ้น (bullish impulse wave pattern) โครงสร้างของคลื่นนี้คล้ายกับคู่สกุล EUR/USD จนถึงวันที่ 28 กุมภาพันธ์ ตลาดได้สร้างโครงสร้างการปรับฐานที่ชัดเจนโดยปล่อยให้ข้อสงสัยน้อยลง อย่างไรก็ตาม ความต้องการในดอลลาร์สหรัฐเริ่มลดลงอย่างรวดเร็ว
โครงสร้างของคลื่นบนกราฟ 4 ชั่วโมงของคู่เงิน EUR/USD ได้เปลี่ยนเป็นโครงสร้างขาขึ้นและยังคงดำเนินไปในทิศทางนั้น ไม่มีข้อสงสัยว่า การเปลี่ยนแปลงนี้ได้รับอิทธิพลจากนโยบายการค้าของสหรัฐฯ ที่ออกมาใหม่ๆ ก่อนวันที่ 28 กุมภาพันธ์ ที่ค่าเงินดอลลาร์สหรัฐเริ่มอ่อนค่าลงอย่างรวดเร็ว รูปแบบคลื่นบ่งชี้ภาพแนวโน้มขาลงที่ชัดเจน โดยมีคลื่นปรับตัว
รูปแบบคลื่นในกราฟ 4 ชั่วโมงของ EUR/USD ได้เปลี่ยนเป็นโครงสร้างตลาดขาขึ้นและยังคงถือรูปแบบนี้ไว้ ฉันเชื่อว่าไม่มีข้อสงสัยว่า การเปลี่ยนแปลงนี้เกิดขึ้นเนื่องจากนโยบายการค้าของสหรัฐฯ ใหม่ จนถึงวันที่ 28 กุมภาพันธ์ เมื่อค่าเงินดอลลาร์สหรัฐเริ่มลดลงอย่างรวดเร็ว รูปแบบคลื่นสะท้อนถึงแนวโน้มขาลงอย่างชัดเจนและกำลังก่อตัวคลื่นปรับฐาน Wave
โครงสร้างคลื่นของ GBP/USD ยังคงบ่งชี้ถึงการสร้างรูปแบบคลื่นปรับตัวขึ้นที่เป็นแรงกระตุ้น รูปแบบคลื่นนี้คล้ายคลึงกับของ EUR/USD อย่างมาก จนถึงวันที่ 28 กุมภาพันธ์ เราสังเกตเห็นการพัฒนาโครงสร้างการปรับตัวที่น่าเชื่อถือจนไม่ก่อให้เกิดข้อสงสัย อย่างไรก็ตาม ความต้องการเงินดอลลาร์สหรัฐเริ่มลดลงอย่างรวดเร็ว ส่งผลให้เกิดการกลับแนวโน้มขึ้นด้านบน คลื่นที่
โครงสร้างคลื่นสำหรับ GBP/USD ยังคงบ่งบอกถึงการพัฒนาของรูปแบบคลื่นกระทิงที่มีแรงกระตุ้น โครงสร้างคลื่นนี้มีลักษณะคล้ายกับของ EUR/USD จนถึงวันที่ 28 กุมภาพันธ์ เราสังเกตการเกิดขึ้นของโครงสร้างการแก้ไขที่มั่นคงซึ่งไม่มีข้อสงสัย อย่างไรก็ตาม ความต้องการในดอลลาร์สหรัฐลดลงอย่างรวดเร็ว ทำให้เกิดการเปลี่ยนแปลงแนวโน้มเป็นขาขึ้น คลื่น 2 ของแนวโน้มนี้เกิดในรูปแบบคลื่นเดียว
GBP/USD การวิเคราะห์: ตั้งแต่เดือนมกราคม เงินฟุนด์อังกฤษได้มีแนวโน้มเพิ่มขึ้น ส่วนที่ยังไม่สมบูรณ์ในปัจจุบันเริ่มต้นในวันที่ 8 เมษายน ในคลื่นนี้ ส่วนสุดท้ายยังไม่สมบูรณ์ ราคาได้ทะลุผ่านโซนชั้นต้านระหว่างประเทศที่สำคัญในกรอบเวลารายวัน ซึ่งตอนนี้กลายเป็นฐานราก ในการให้คลื่นดำเนินต่อไป ราคาต้องเข้มแข็งที่จะอยู่ข้างบนในพื้นที่นี้ คาดการณ์: เคลื่อนไหวแนวนอนคาดว่าจะเกิดขึ้นในสัปดาห์หน้า
EUR/USD การวิเคราะห์: ตั้งแต่เดือนเมษายน คู่เงินหลักของยูโรได้กำลังก่อตัวเป็นรูปแบบธงแนวนอนลดลง จากโซนที่แข็งแกร่งซึ่งอาจมีการกลับตัวในกรอบเวลารายวันในช่วงกลางเดือนพฤษภาคม ราคาเริ่มมีการปรับตัวขึ้นโดยสร้างคลื่นการแก้ไข โครงสร้างของช่วงนี้ยังไม่เสร็จสิ้น การคาดการณ์: ในสัปดาห์ที่จะถึงนี้ คาดว่าจะมีการเคลื่อนไหวแบบด้านข้างอย่างต่อเนื่อง อาจเกิดการลดลงเล็กน้อยและแรงกดดันต่อโซนแนวรับในช่วงต้นสัปดาห์ จากนั้นมีโอกาสที่จะมีการกลับตัวและการฟื้นตัวของแนวโน้มขาขึ้นไปยังโซนแนวต้าน ซึ่งช่วงที่มีการเคลื่อนไหวขึ้นที่แข็งแกร่งที่สุดอาจเกิดขึ้นใกล้สุดสัปดาห์ จุดกลับตัวที่เป็นไปได้ แนวต้าน
สำหรับคู่เงิน GBP/USD โครงสร้างของกราฟยังคงบ่งชี้ถึงการพัฒนาของแนวโน้มขาขึ้นที่มีแรงดันตลอดเวลา โครงสร้างของกราฟเกือบเหมือนกับ EUR/USD ก่อนวันที่ 28 กุมภาพันธ์ เราสังเกตเห็นการสร้างโครงสร้างการปรับฐานที่ชัดเจน ไม่ทำให้เกิดความสงสัย อย่างไรก็ตาม ความต้องการดอลลาร์สหรัฐเริ่มลดลงอย่างรวดเร็ว จนนำไปสู่การกลับทิศทาง แนวโน้มที่
ตารางของ Forex
เวอร์ชั่นแบบ หน้าเว็บไซต์

Your IP address shows that you are currently located in the USA. If you are a resident of the United States, you are prohibited from using the services of InstaFintech Group including online trading, online transfers, deposit/withdrawal of funds, etc.
If you think you are seeing this message by mistake and your location is not the US, kindly proceed to the website. Otherwise, you must leave the website in order to comply with government restrictions.
Why does your IP address show your location as the USA?
Please confirm whether you are a US resident or not by clicking the relevant button below. If you choose the wrong option, being a US resident, you will not be able to open an account with InstaTrade anyway.
We are sorry for any inconvenience caused by this message.

