รูปแบบกราฟ

รูปแบบกราฟนั้นเป็น รูปจำลองทางกราฟฟิกที่ถูกสร้างขึ้นมาในชาร์ตจากราคา อ้างอิงตามหนึ่งในการวิเคราะห์ทางเทคนิค ที่ตั้งสมมติฐานมาว่า ประวัติศาสตร์ (การเคลื่อนไหวของราคา) มักจะเกิดขึ้นซ้ำรอยเดิม นั้นหมายความว่า การเคลื่อนไหวของราคาก็หมือนกับ สถานการณ์หนึ่งที่จะสามารถทำการคาดการณ์ไปยังทิศทางในอนาคต ตามเหตุการณ์ที่น่าจะมีความเป็นไปได้สูง
รูปแบบกราฟที่สำคัญจากทาง InstaTrade นั้นจะเป็นการบริการที่มีการใช้อย่างง่ายดาย ซึ่งจะช่วยให้คุณสามารถทราบถึงการเปลี่ยนแปลงล่าสุด ในตลาดได้ และสามารถรับมือกับข้อมูลจากทางตลาดได้ทันท่วงที ในการบริการของพวกเรานั้น คุณจะพบกับรูปแบบกราฟล่าสุดและมีความสำคัญมากที่สุดในทุกๆคู่สกุลเงิน และทุกๆขอบเขตเวลา
Head and Shoulders
was formed on 25.03 at 17:01:08 (UTC+0)
signal strength 1 of 5
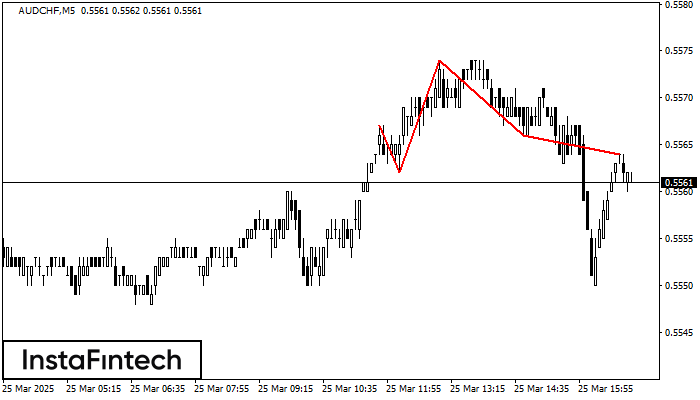
The technical pattern called Head and Shoulders has appeared on the chart of AUDCHF M5. There are weighty reasons to suggest that the price will surpass the Neckline 0.5562/0.5566 after the right shoulder has been formed. So, the trend is set to change with the price heading for 0.5551.
The M5 and M15 time frames may have more false entry points.
ดูเพิ่มเติม
- All
- All
- Bearish Rectangle
- Bearish Symmetrical Triangle
- Bearish Symmetrical Triangle
- Bullish Rectangle
- Double Top
- Double Top
- Triple Bottom
- Triple Bottom
- Triple Top
- Triple Top
- All
- All
- Buy
- Sale
- All
- 1
- 2
- 3
- 4
- 5
รูปแบบกราฟจุดสองยอดขาลง (Double Bottom)
was formed on 17.04 at 20:20:19 (UTC+0)
signal strength 1 of 5

รูปแบบ รูปแบบกราฟจุดสองยอดขาลง (Double Bottom) ถูกสร้างขึ้นมาใน EURNZD M5 คุณลักษณะ: ระดับของแนวรับ 1.8992; ระดับของแนวต้าน 1.9020; ความกว้างของรูปแบบ 28 จุด
ขอบเตระยะเวลาใน M5 และ M15 อาจจะมีตำแหน่งการเข้าใช้งานที่ผิดพลาดมากยิ่งขึ้น
Open chart in a new window
รูปแบบกราฟจุดสองยอด (Double Top)
was formed on 17.04 at 19:47:53 (UTC+0)
signal strength 2 of 5
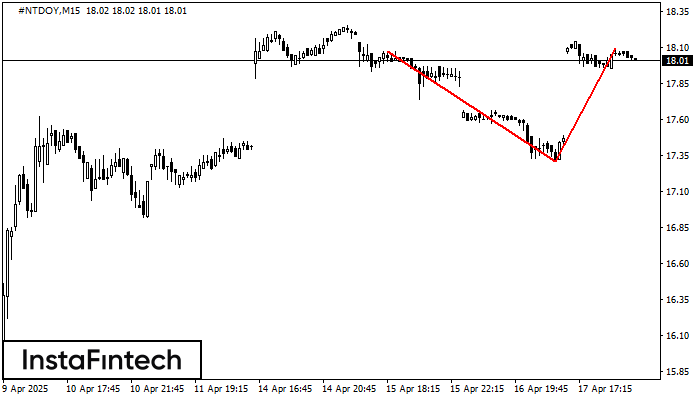
รูปแบบการย้อนตัว รูปแบบกราฟจุดสองยอด (Double Top) ได้ถูกสร้างขึ้นมาใน #NTDOY M15 คุณลักษณะ: ขอบเขตด้านบน 18.07; ขอบเขตด้านล่าง 17.31; ความกว้างของกราฟรูปแบบนี้คือ 78 จุด
ขอบเตระยะเวลาใน M5 และ M15 อาจจะมีตำแหน่งการเข้าใช้งานที่ผิดพลาดมากยิ่งขึ้น
Open chart in a new window
รูปแบบกราฟธงปลายแหลมขาขึ้น (Bullish pennant)
was formed on 17.04 at 19:46:18 (UTC+0)
signal strength 2 of 5

รูปแบบ รูปแบบกราฟธงปลายแหลมขาขึ้น (Bullish pennant) ได้ถูกสร้างขึ้นมาในชาร์ต AUDJPY M15 มันเป็นประเภทของรูปแบบต่อเนื่อง ตามที่คาดไว้ กรณีที่ราคาทรงตัวอยุ่สูงกว่าระดับสูงสุดของกราฟรูปธงปลายแหลมที่ 91.06 ก็อาจจะมีแนวโน้มขาขึ้นต่อไป
ขอบเตระยะเวลาใน M5 และ M15 อาจจะมีตำแหน่งการเข้าใช้งานที่ผิดพลาดมากยิ่งขึ้น
Open chart in a new window