รูปแบบกราฟ

รูปแบบกราฟนั้นเป็น รูปจำลองทางกราฟฟิกที่ถูกสร้างขึ้นมาในชาร์ตจากราคา อ้างอิงตามหนึ่งในการวิเคราะห์ทางเทคนิค ที่ตั้งสมมติฐานมาว่า ประวัติศาสตร์ (การเคลื่อนไหวของราคา) มักจะเกิดขึ้นซ้ำรอยเดิม นั้นหมายความว่า การเคลื่อนไหวของราคาก็หมือนกับ สถานการณ์หนึ่งที่จะสามารถทำการคาดการณ์ไปยังทิศทางในอนาคต ตามเหตุการณ์ที่น่าจะมีความเป็นไปได้สูง
รูปแบบกราฟที่สำคัญจากทาง InstaTrade นั้นจะเป็นการบริการที่มีการใช้อย่างง่ายดาย ซึ่งจะช่วยให้คุณสามารถทราบถึงการเปลี่ยนแปลงล่าสุด ในตลาดได้ และสามารถรับมือกับข้อมูลจากทางตลาดได้ทันท่วงที ในการบริการของพวกเรานั้น คุณจะพบกับรูปแบบกราฟล่าสุดและมีความสำคัญมากที่สุดในทุกๆคู่สกุลเงิน และทุกๆขอบเขตเวลา
Double Top
was formed on 03.04 at 09:15:02 (UTC+0)
signal strength 2 of 5
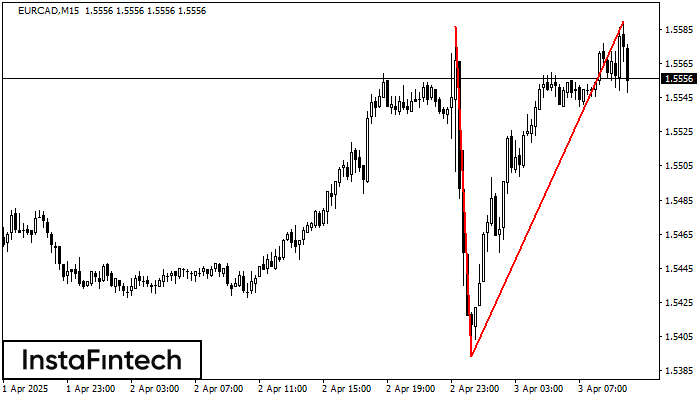
The Double Top reversal pattern has been formed on EURCAD M15. Characteristics: the upper boundary 1.5587; the lower boundary 1.5393; the width of the pattern is 197 points. Sell trades are better to be opened below the lower boundary 1.5393 with a possible movements towards the 1.5371 level.
The M5 and M15 time frames may have more false entry points.
ดูเพิ่มเติม
- All
- All
- Bearish Rectangle
- Bearish Symmetrical Triangle
- Bearish Symmetrical Triangle
- Bullish Rectangle
- Double Top
- Double Top
- Triple Bottom
- Triple Bottom
- Triple Top
- Triple Top
- All
- All
- Buy
- Sale
- All
- 1
- 2
- 3
- 4
- 5
รูปแบบกราฟจุดสองยอดขาลง (Double Bottom)
was formed on 17.04 at 20:20:19 (UTC+0)
signal strength 1 of 5

รูปแบบ รูปแบบกราฟจุดสองยอดขาลง (Double Bottom) ถูกสร้างขึ้นมาใน EURNZD M5 คุณลักษณะ: ระดับของแนวรับ 1.8992; ระดับของแนวต้าน 1.9020; ความกว้างของรูปแบบ 28 จุด
ขอบเตระยะเวลาใน M5 และ M15 อาจจะมีตำแหน่งการเข้าใช้งานที่ผิดพลาดมากยิ่งขึ้น
Open chart in a new window
รูปแบบกราฟจุดสองยอด (Double Top)
was formed on 17.04 at 19:47:53 (UTC+0)
signal strength 2 of 5
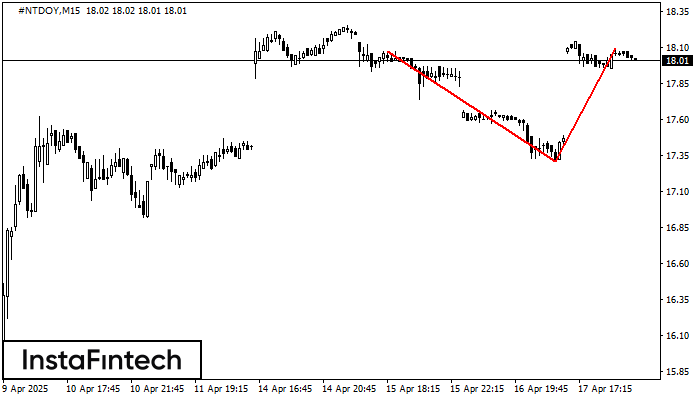
รูปแบบการย้อนตัว รูปแบบกราฟจุดสองยอด (Double Top) ได้ถูกสร้างขึ้นมาใน #NTDOY M15 คุณลักษณะ: ขอบเขตด้านบน 18.07; ขอบเขตด้านล่าง 17.31; ความกว้างของกราฟรูปแบบนี้คือ 78 จุด
ขอบเตระยะเวลาใน M5 และ M15 อาจจะมีตำแหน่งการเข้าใช้งานที่ผิดพลาดมากยิ่งขึ้น
Open chart in a new window
รูปแบบกราฟธงปลายแหลมขาขึ้น (Bullish pennant)
was formed on 17.04 at 19:46:18 (UTC+0)
signal strength 2 of 5

รูปแบบ รูปแบบกราฟธงปลายแหลมขาขึ้น (Bullish pennant) ได้ถูกสร้างขึ้นมาในชาร์ต AUDJPY M15 มันเป็นประเภทของรูปแบบต่อเนื่อง ตามที่คาดไว้ กรณีที่ราคาทรงตัวอยุ่สูงกว่าระดับสูงสุดของกราฟรูปธงปลายแหลมที่ 91.06 ก็อาจจะมีแนวโน้มขาขึ้นต่อไป
ขอบเตระยะเวลาใน M5 และ M15 อาจจะมีตำแหน่งการเข้าใช้งานที่ผิดพลาดมากยิ่งขึ้น
Open chart in a new window