

รูปแบบกราฟ

รูปแบบกราฟนั้นเป็น รูปจำลองทางกราฟฟิกที่ถูกสร้างขึ้นมาในชาร์ตจากราคา อ้างอิงตามหนึ่งในการวิเคราะห์ทางเทคนิค ที่ตั้งสมมติฐานมาว่า ประวัติศาสตร์ (การเคลื่อนไหวของราคา) มักจะเกิดขึ้นซ้ำรอยเดิม นั้นหมายความว่า การเคลื่อนไหวของราคาก็หมือนกับ สถานการณ์หนึ่งที่จะสามารถทำการคาดการณ์ไปยังทิศทางในอนาคต ตามเหตุการณ์ที่น่าจะมีความเป็นไปได้สูง
รูปแบบกราฟที่สำคัญจากทาง InstaTrade นั้นจะเป็นการบริการที่มีการใช้อย่างง่ายดาย ซึ่งจะช่วยให้คุณสามารถทราบถึงการเปลี่ยนแปลงล่าสุด ในตลาดได้ และสามารถรับมือกับข้อมูลจากทางตลาดได้ทันท่วงที ในการบริการของพวกเรานั้น คุณจะพบกับรูปแบบกราฟล่าสุดและมีความสำคัญมากที่สุดในทุกๆคู่สกุลเงิน และทุกๆขอบเขตเวลา
Bearish Symmetrical Triangle
was formed on 07.04 at 20:51:47 (UTC+0)
signal strength 2 of 5

According to the chart of M15, #INTC formed the Bearish Symmetrical Triangle pattern. Description: The lower border is 18.56/19.63 and upper border is 20.82/19.63. The pattern width is measured on the chart at -226 pips. The formation of the Bearish Symmetrical Triangle pattern evidently signals a continuation of the downward trend. In other words, if the scenario comes true and #INTC breaches the lower border, the price could continue its move toward 19.41.
The M5 and M15 time frames may have more false entry points.
ดูเพิ่มเติม
- All
- All
- Bearish Rectangle
- Bearish Symmetrical Triangle
- Bearish Symmetrical Triangle
- Bullish Rectangle
- Double Top
- Double Top
- Triple Bottom
- Triple Bottom
- Triple Top
- Triple Top
- All
- All
- Buy
- Sale
- All
- 1
- 2
- 3
- 4
- 5
Double Bottom
was formed on 30.04 at 15:00:30 (UTC+0)
signal strength 3 of 5
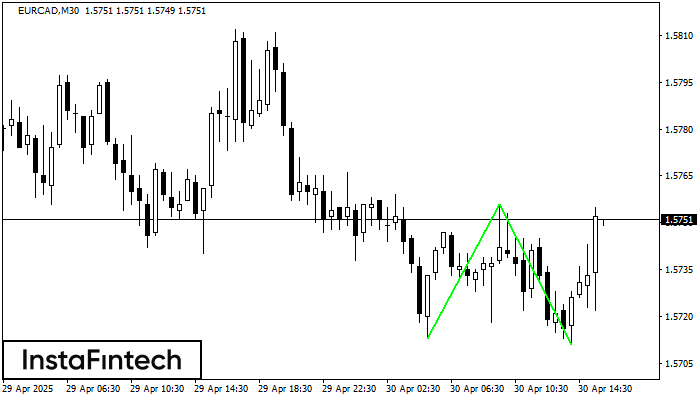
The Double Bottom pattern has been formed on EURCAD M30. This formation signals a reversal of the trend from downwards to upwards. The signal is that a buy trade should
Open chart in a new window
Double Bottom
was formed on 30.04 at 15:00:21 (UTC+0)
signal strength 4 of 5
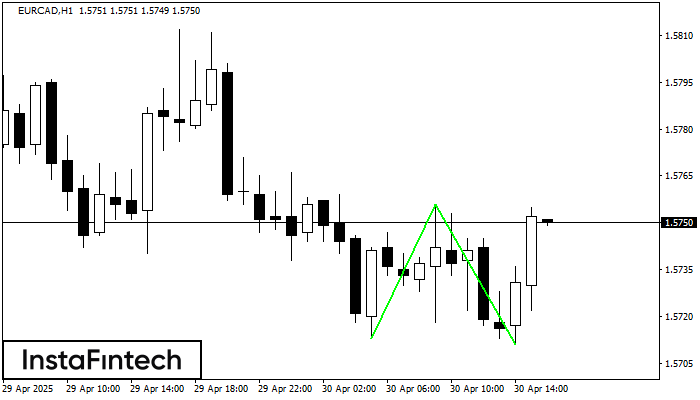
The Double Bottom pattern has been formed on EURCAD H1. Characteristics: the support level 1.5713; the resistance level 1.5756; the width of the pattern 43 points. If the resistance level
Open chart in a new window
Double Top
was formed on 30.04 at 14:30:27 (UTC+0)
signal strength 2 of 5
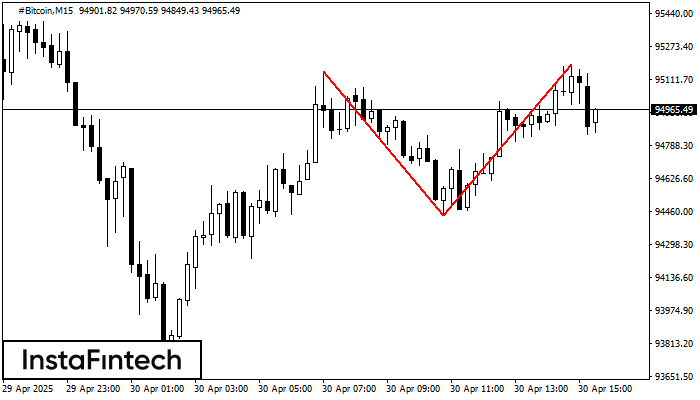
The Double Top reversal pattern has been formed on #Bitcoin M15. Characteristics: the upper boundary 95150.89; the lower boundary 94442.57; the width of the pattern is 74407 points. Sell trades
The M5 and M15 time frames may have more false entry points.
Open chart in a new window


