Актуальні патерни

Патерни - це графічні моделі, які "малюють" ціни на графіку. Один з постулатів технічного аналізу говорить нам про те, що історія (рух ціни) завжди повторюється. Це означає, що в схожих ситуаціях рух ціни, найчастіше, буде схожим, що дозволяє з високою часткою ймовірності спрогнозувати подальший розвиток ситуації.
Актуальні патерни від ІнстаФорекс - це зручний сервіс, який дозволить вам завжди бути в курсі останніх змін на ринку і вчасно реагувати на підказки, що з'явилися, від ринку. У нашому сервісі ви завжди знайдете найсвіжіші і актуальніші патерни на будь-якій парі і на будь-якому таймфреймі.
Бычий симметричный треугольник
сформирован 17.04 в 03:06:49 (UTC+0)
сила сигнала 3 из 5

По EURNZD на M30 фигура «Бычий симметричный треугольник». Характеристика: Фигура продолжения тренда; Координаты границ – верхняя 1.9252, нижняя 1.9161. Проекция ширины фигуры 91 пунктов. Прогноз: В случае пробоя верхней границы 1.9252 цена, вероятнее всего, продолжит движение к 1.9237.
- Все
- Все
- Bearish Rectangle
- Bearish Symmetrical Triangle
- Bearish Symmetrical Triangle
- Bullish Rectangle
- Double Top
- Double Top
- Triple Bottom
- Triple Bottom
- Triple Top
- Triple Top
- Все
- Все
- Покупка
- Продажа
- Все
- 1
- 2
- 3
- 4
- 5
Double Bottom
was formed on 30.05 at 07:55:32 (UTC+0)
signal strength 1 of 5
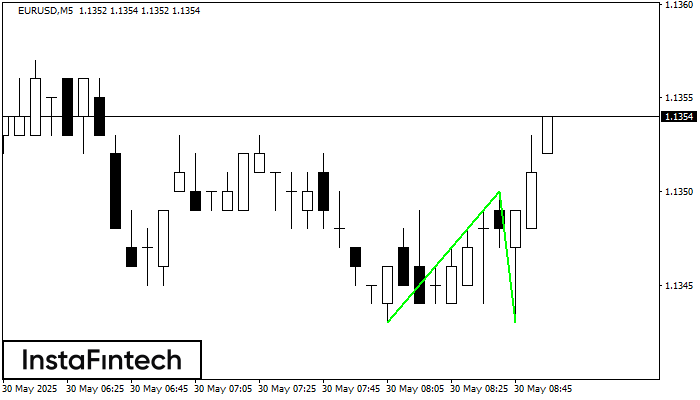
The Double Bottom pattern has been formed on EURUSD M5. Characteristics: the support level 1.1343; the resistance level 1.1350; the width of the pattern 7 points. If the resistance level
The M5 and M15 time frames may have more false entry points.
Open chart in a new window
Inverse Head and Shoulder
was formed on 30.05 at 07:31:35 (UTC+0)
signal strength 3 of 5
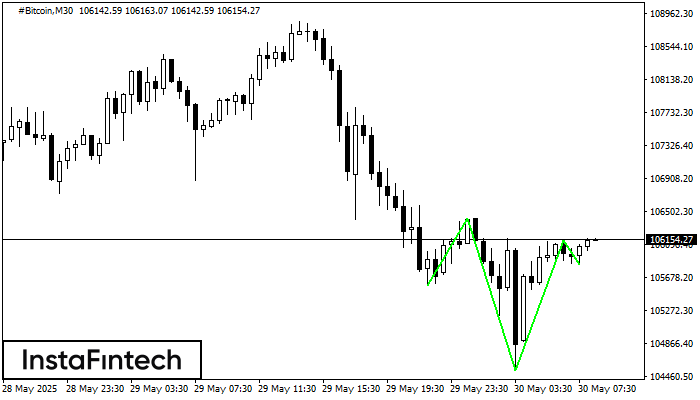
According to M30, #Bitcoin is shaping the technical pattern – the Inverse Head and Shoulder. In case the Neckline 106415.11/106138.63 is broken out, the instrument is likely to move toward
Open chart in a new window
Double Bottom
was formed on 30.05 at 07:15:27 (UTC+0)
signal strength 2 of 5
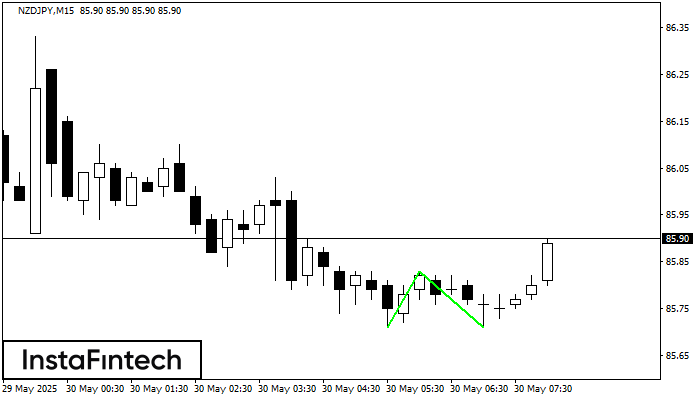
The Double Bottom pattern has been formed on NZDJPY M15. This formation signals a reversal of the trend from downwards to upwards. The signal is that a buy trade should
The M5 and M15 time frames may have more false entry points.
Open chart in a new window