Dolzarb patternlar

Двойная вершина
сформирован 21.03 в 21:20:50 (UTC+0)
сила сигнала 1 из 5
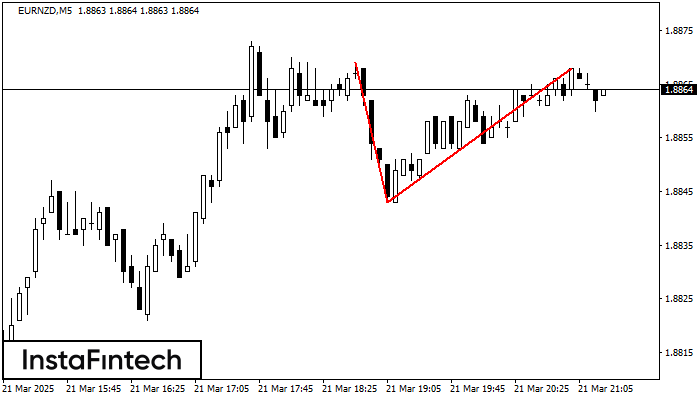
По EURNZD на M5 сформировалась разворотная фигура «Двойная вершина». Характеристика: Верхняя граница 1.8869; Нижняя граница 1.8843; Ширина фигуры 25 пунктов. Позицию на продажу возможно открыть ниже нижней границы 1.8843, с перспективой хода к уровню 1.8828.
Таймфреймы М5 и М15 могут иметь больше ложных точек входа.
- Все
- Все
- Bearish Rectangle
- Bearish Symmetrical Triangle
- Bearish Symmetrical Triangle
- Bullish Rectangle
- Double Top
- Double Top
- Triple Bottom
- Triple Bottom
- Triple Top
- Triple Top
- Все
- Все
- Покупка
- Продажа
- Все
- 1
- 2
- 3
- 4
- 5
Double Bottom
was formed on 30.04 at 08:00:27 (UTC+0)
signal strength 3 of 5
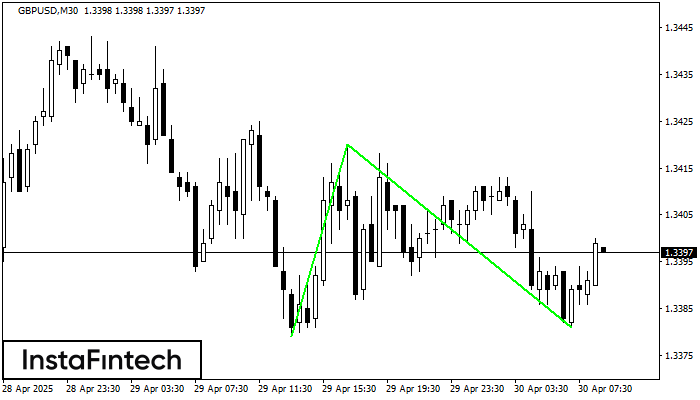
The Double Bottom pattern has been formed on GBPUSD M30. Characteristics: the support level 1.3379; the resistance level 1.3420; the width of the pattern 41 points. If the resistance level
Open chart in a new window
Triple Top
was formed on 30.04 at 07:55:10 (UTC+0)
signal strength 1 of 5
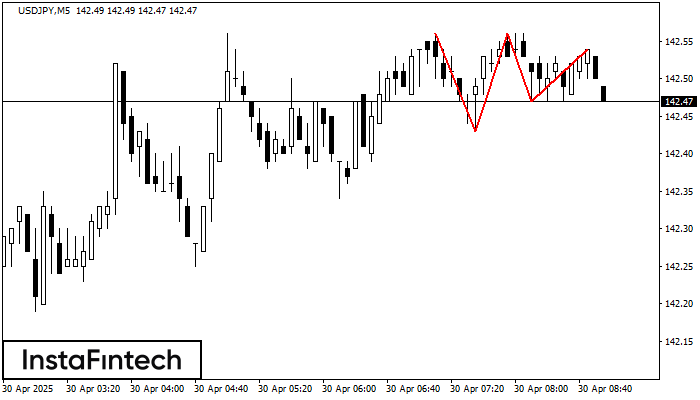
The Triple Top pattern has formed on the chart of the USDJPY M5. Features of the pattern: borders have an ascending angle; the lower line of the pattern
The M5 and M15 time frames may have more false entry points.
Open chart in a new window
Bearish Symmetrical Triangle
was formed on 30.04 at 06:15:48 (UTC+0)
signal strength 1 of 5

According to the chart of M5, USDCHF formed the Bearish Symmetrical Triangle pattern. This pattern signals a further downward trend in case the lower border 0.8226 is breached. Here
The M5 and M15 time frames may have more false entry points.
Open chart in a new window