

Dolzarb patternlar

Голова и плечи
сформирован 25.03 в 17:01:08 (UTC+0)
сила сигнала 1 из 5
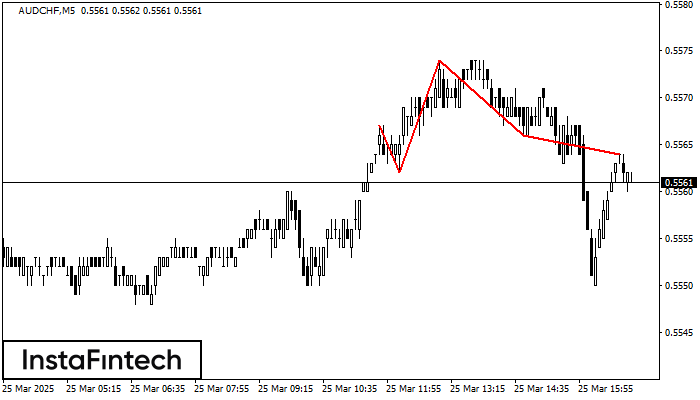
Графическая фигура «Голова и плечи» сформировалась по инструменту AUDCHF на M5. Вероятно предполагать, что после формирования правого плеча цена преодолеет уровень шеи 0.5562/0.5566, изменяя тем самым тенденцию и фактически направляя нас к значению 0.5551.
Таймфреймы М5 и М15 могут иметь больше ложных точек входа.
Shuningdek ko'ring
- Все
- Все
- Bearish Rectangle
- Bearish Symmetrical Triangle
- Bearish Symmetrical Triangle
- Bullish Rectangle
- Double Top
- Double Top
- Triple Bottom
- Triple Bottom
- Triple Top
- Triple Top
- Все
- Все
- Покупка
- Продажа
- Все
- 1
- 2
- 3
- 4
- 5
Double Bottom
was formed on 17.04 at 20:20:19 (UTC+0)
signal strength 1 of 5

The Double Bottom pattern has been formed on EURNZD M5. Characteristics: the support level 1.8992; the resistance level 1.9020; the width of the pattern 28 points. If the resistance level
The M5 and M15 time frames may have more false entry points.
Open chart in a new window
Double Top
was formed on 17.04 at 19:47:53 (UTC+0)
signal strength 2 of 5
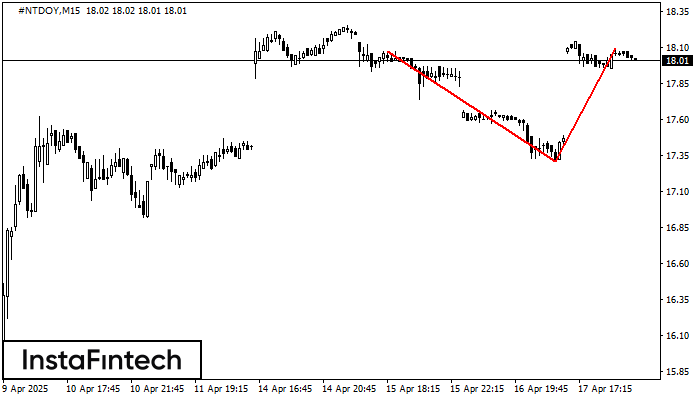
The Double Top reversal pattern has been formed on #NTDOY M15. Characteristics: the upper boundary 18.07; the lower boundary 17.31; the width of the pattern is 78 points. Sell trades
The M5 and M15 time frames may have more false entry points.
Open chart in a new window
Bullish pennant
was formed on 17.04 at 19:46:18 (UTC+0)
signal strength 2 of 5

The Bullish pennant pattern is formed on the AUDJPY M15 chart. It is a type of the continuation pattern. Supposedly, in case the price is fixed above the pennant’s high
The M5 and M15 time frames may have more false entry points.
Open chart in a new window


