Dolzarb patternlar

Двойное дно
сформирован 29.03 в 11:00:31 (UTC+0)
сила сигнала 3 из 5

Сформирована фигура «Двойное дно» на графике #Bitcoin M30. Характеристика: Уровень поддержки 83552.05; Уровень сопротивления 84588.82; Ширина фигуры 103677 пунктов. В случае пробоя уровня сопротивления можно будет прогнозировать изменение тенденции, где первая точка фиксации прибыли находится на расстоянии 96966 пунктов.
Shuningdek ko'ring
- Все
- Все
- Bearish Rectangle
- Bearish Symmetrical Triangle
- Bearish Symmetrical Triangle
- Bullish Rectangle
- Double Top
- Double Top
- Triple Bottom
- Triple Bottom
- Triple Top
- Triple Top
- Все
- Все
- Покупка
- Продажа
- Все
- 1
- 2
- 3
- 4
- 5
Bullish Rectangle
сформирован 01.04 в 21:16:19 (UTC+0)
сила сигнала 2 из 5
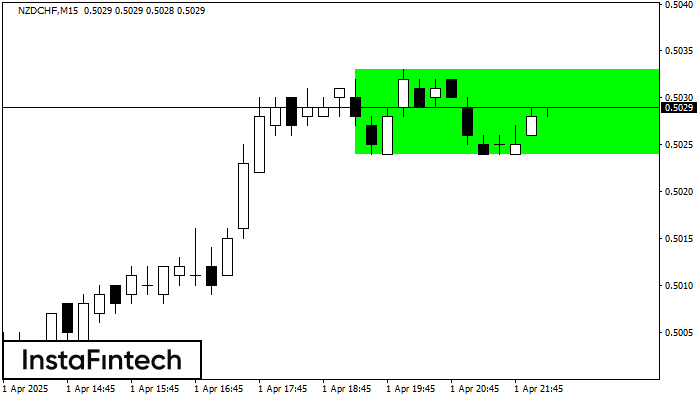
According to the chart of M15, NZDCHF formed the Bullish Rectangle. This type of a pattern indicates a trend continuation. It consists of two levels: resistance 0.5033 and support 0.5024
The M5 and M15 time frames may have more false entry points.
Открыть график инструмента в новом окне
Bullish Rectangle
сформирован 01.04 в 21:01:49 (UTC+0)
сила сигнала 2 из 5
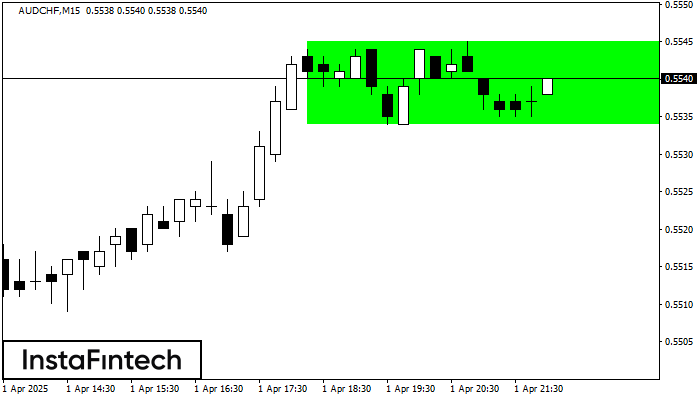
According to the chart of M15, AUDCHF formed the Bullish Rectangle. This type of a pattern indicates a trend continuation. It consists of two levels: resistance 0.5545 and support 0.5534
The M5 and M15 time frames may have more false entry points.
Открыть график инструмента в новом окне
Bullish Rectangle
сформирован 01.04 в 20:57:49 (UTC+0)
сила сигнала 1 из 5
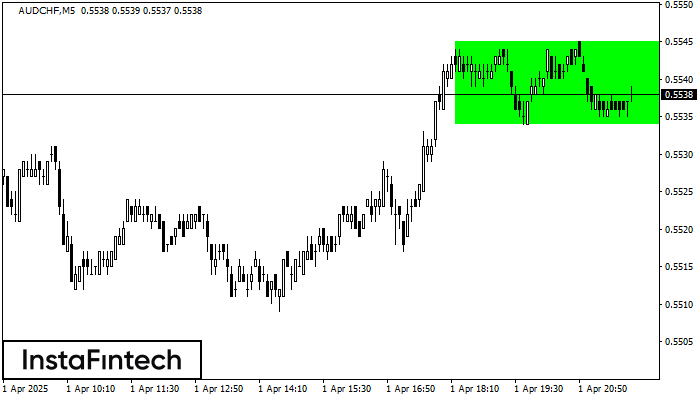
According to the chart of M5, AUDCHF formed the Bullish Rectangle which is a pattern of a trend continuation. The pattern is contained within the following borders: the lower border
The M5 and M15 time frames may have more false entry points.
Открыть график инструмента в новом окне