

Dolzarb patternlar

Двойное дно
сформирован 07.04 в 21:20:40 (UTC+0)
сила сигнала 1 из 5
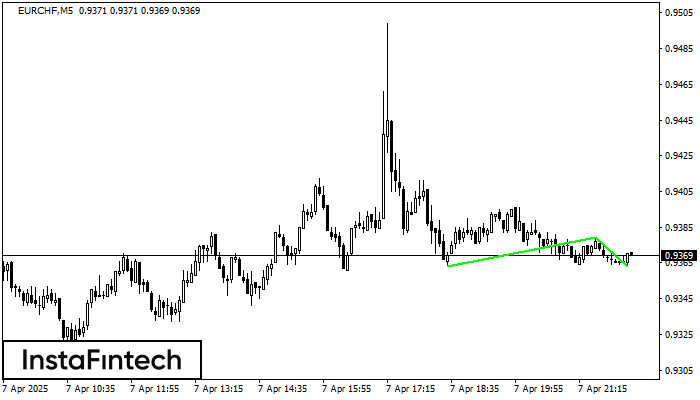
Сформирована фигура «Двойное дно» на графике EURCHF M5. Верхняя граница 0.9379; Нижняя граница 0.9363; Ширина фигуры 16 пунктов. В случае пробоя верхней границы 0.9379 можно будет прогнозировать изменение тенденции, где ширина фигуры и будет являться расстоянием предположительного Тейк Профита.
Таймфреймы М5 и М15 могут иметь больше ложных точек входа.
- Все
- Все
- Bearish Rectangle
- Bearish Symmetrical Triangle
- Bearish Symmetrical Triangle
- Bullish Rectangle
- Double Top
- Double Top
- Triple Bottom
- Triple Bottom
- Triple Top
- Triple Top
- Все
- Все
- Покупка
- Продажа
- Все
- 1
- 2
- 3
- 4
- 5
Double Bottom
was formed on 17.04 at 15:29:57 (UTC+0)
signal strength 2 of 5

The Double Bottom pattern has been formed on #EBAY M15; the upper boundary is 67.35; the lower boundary is 65.16. The width of the pattern is 215 points. In case
The M5 and M15 time frames may have more false entry points.
Open chart in a new window
Head and Shoulders
was formed on 17.04 at 14:00:03 (UTC+0)
signal strength 2 of 5

The technical pattern called Head and Shoulders has appeared on the chart of EURCHF M15. There are weighty reasons to suggest that the price will surpass the Neckline 0.9278/0.9279 after
The M5 and M15 time frames may have more false entry points.
Open chart in a new window
Bearish Symmetrical Triangle
was formed on 17.04 at 13:58:48 (UTC+0)
signal strength 1 of 5

According to the chart of M5, GBPUSD formed the Bearish Symmetrical Triangle pattern. Trading recommendations: A breach of the lower border 1.3203 is likely to encourage a continuation
The M5 and M15 time frames may have more false entry points.
Open chart in a new window


