

Dolzarb patternlar

Двойное дно
сформирован 16.04 в 17:00:14 (UTC+0)
сила сигнала 3 из 5
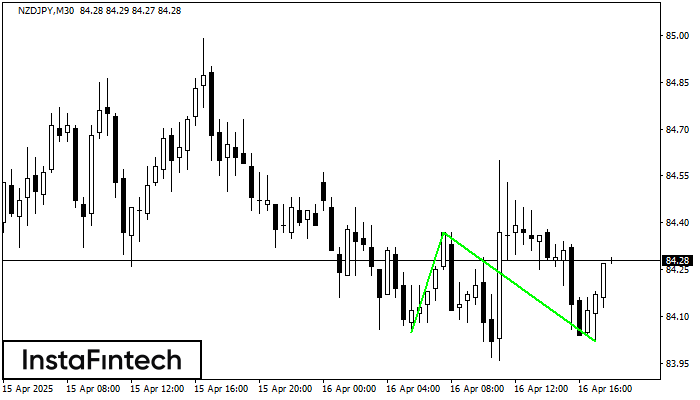
Сформирована фигура «Двойное дно» на графике NZDJPY M30. Данное формирование сигнализирует об изменении тенденции с нисходящего на восходящее движение. Сигнал: Торговую позицию на покупку следует открывать после пробоя верхней границы фигуры 84.37, где перспектива будущего хода будет являться шириной текущей фигуры - 32 пунктов.
Shuningdek ko'ring
- Все
- Все
- Bearish Rectangle
- Bearish Symmetrical Triangle
- Bearish Symmetrical Triangle
- Bullish Rectangle
- Double Top
- Double Top
- Triple Bottom
- Triple Bottom
- Triple Top
- Triple Top
- Все
- Все
- Покупка
- Продажа
- Все
- 1
- 2
- 3
- 4
- 5
Head and Shoulders
сформирован 05.06 в 04:45:35 (UTC+0)
сила сигнала 1 из 5
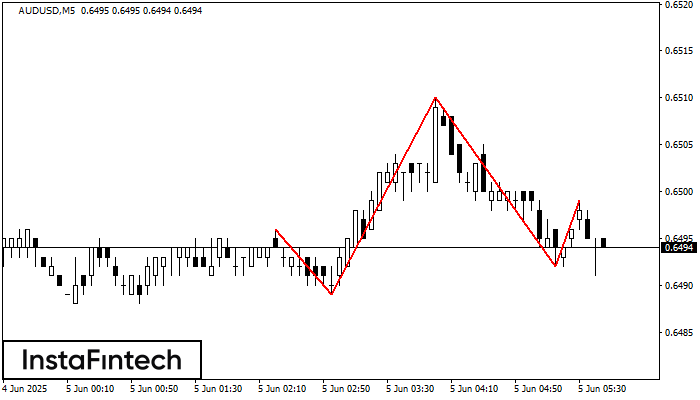
The technical pattern called Head and Shoulders has appeared on the chart of AUDUSD M5. There are weighty reasons to suggest that the price will surpass the Neckline 0.6489/0.6492 after
The M5 and M15 time frames may have more false entry points.
Открыть график инструмента в новом окне
Bearish Rectangle
сформирован 05.06 в 04:06:17 (UTC+0)
сила сигнала 2 из 5

According to the chart of M15, EURCHF formed the Bearish Rectangle. The pattern indicates a trend continuation. The upper border is 0.9348, the lower border is 0.9337. The signal means
The M5 and M15 time frames may have more false entry points.
Открыть график инструмента в новом окне
Double Top
сформирован 05.06 в 04:00:46 (UTC+0)
сила сигнала 3 из 5
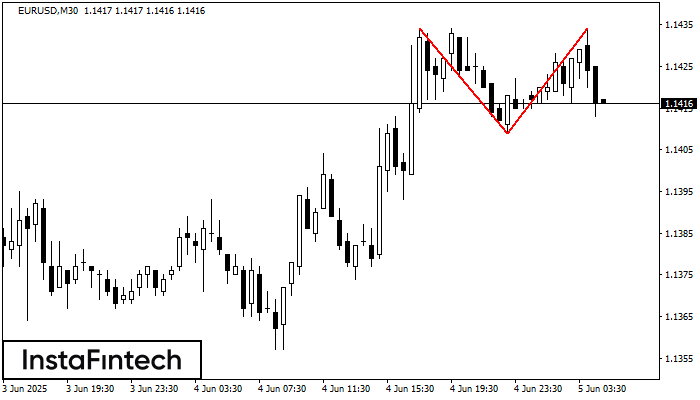
The Double Top pattern has been formed on EURUSD M30. It signals that the trend has been changed from upwards to downwards. Probably, if the base of the pattern 1.1409
Открыть график инструмента в новом окне


