Dolzarb patternlar

Тройная вершина
сформирован 16.04 в 20:00:08 (UTC+0)
сила сигнала 3 из 5

На графике #MA M30 образовалась фигура «Тройная вершина», которая сигнализирует об изменении тенденции. Возможный сценарий: После формирования третьей вершины котировка постарается пробить нижнюю границу 512.83, где трейдеру и стоило бы открывать торговую позицию на продажу. Тейк Профит - это и есть проекция ширины фигуры, которая составляет 861 пунктов.
- Все
- Все
- Bearish Rectangle
- Bearish Symmetrical Triangle
- Bearish Symmetrical Triangle
- Bullish Rectangle
- Double Top
- Double Top
- Triple Bottom
- Triple Bottom
- Triple Top
- Triple Top
- Все
- Все
- Покупка
- Продажа
- Все
- 1
- 2
- 3
- 4
- 5
Double Top
сформирован 06.06 в 13:35:14 (UTC+0)
сила сигнала 1 из 5
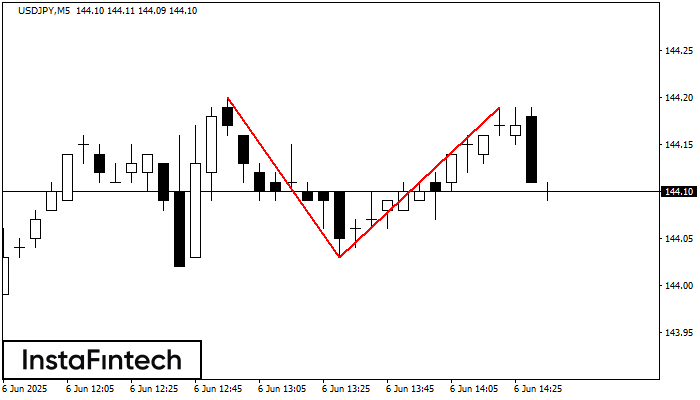
The Double Top reversal pattern has been formed on USDJPY M5. Characteristics: the upper boundary 144.20; the lower boundary 144.03; the width of the pattern is 16 points. Sell trades
The M5 and M15 time frames may have more false entry points.
Открыть график инструмента в новом окне
Bullish Symmetrical Triangle
сформирован 06.06 в 13:32:13 (UTC+0)
сила сигнала 3 из 5
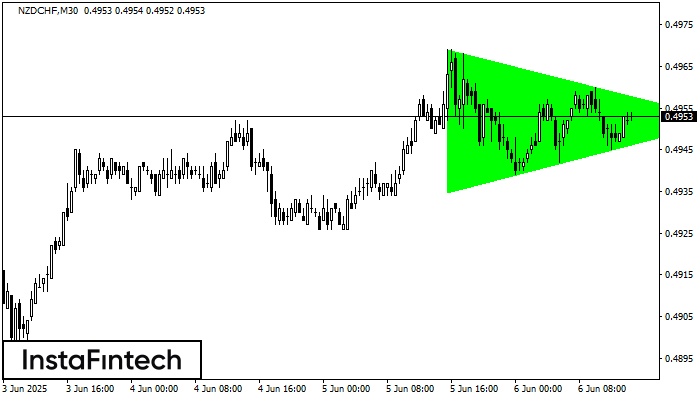
According to the chart of M30, NZDCHF formed the Bullish Symmetrical Triangle pattern. The lower border of the pattern touches the coordinates 0.4935/0.4952 whereas the upper border goes across 0.4969/0.4952
Открыть график инструмента в новом окне
Bullish Rectangle
сформирован 06.06 в 13:05:37 (UTC+0)
сила сигнала 1 из 5
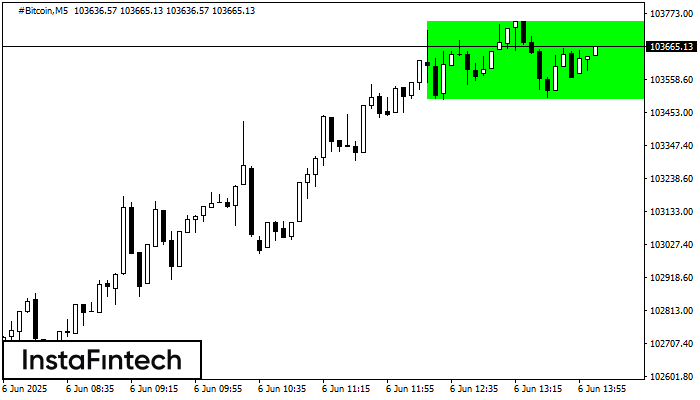
According to the chart of M5, #Bitcoin formed the Bullish Rectangle which is a pattern of a trend continuation. The pattern is contained within the following borders: the lower border
The M5 and M15 time frames may have more false entry points.
Открыть график инструмента в новом окне