

Dolzarb patternlar

Двойное дно
сформирован 17.04 в 08:25:11 (UTC+0)
сила сигнала 1 из 5
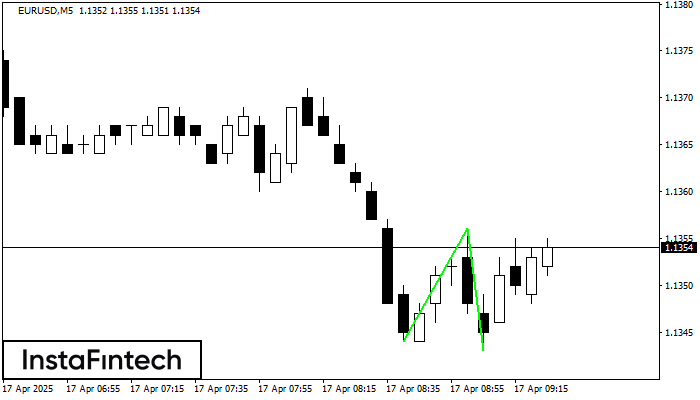
Сформирована фигура «Двойное дно» на графике EURUSD M5. Характеристика: Уровень поддержки 1.1344; Уровень сопротивления 1.1356; Ширина фигуры 12 пунктов. В случае пробоя уровня сопротивления можно будет прогнозировать изменение тенденции, где первая точка фиксации прибыли находится на расстоянии 13 пунктов.
Таймфреймы М5 и М15 могут иметь больше ложных точек входа.
Shuningdek ko'ring
- Все
- Все
- Bearish Rectangle
- Bearish Symmetrical Triangle
- Bearish Symmetrical Triangle
- Bullish Rectangle
- Double Top
- Double Top
- Triple Bottom
- Triple Bottom
- Triple Top
- Triple Top
- Все
- Все
- Покупка
- Продажа
- Все
- 1
- 2
- 3
- 4
- 5
Bearish Rectangle
сформирован 02.06 в 06:43:05 (UTC+0)
сила сигнала 1 из 5
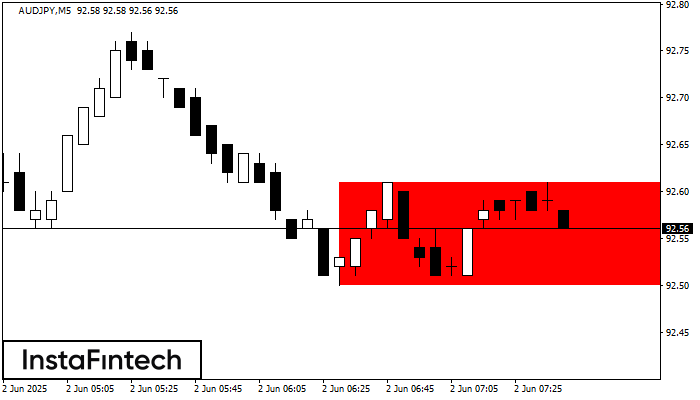
According to the chart of M5, AUDJPY formed the Bearish Rectangle. This type of a pattern indicates a trend continuation. It consists of two levels: resistance 92.61 - 0.00
The M5 and M15 time frames may have more false entry points.
Открыть график инструмента в новом окне
Double Bottom
сформирован 02.06 в 06:15:53 (UTC+0)
сила сигнала 2 из 5
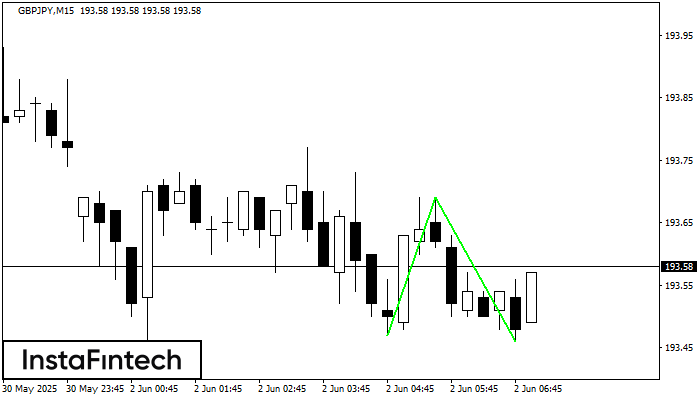
The Double Bottom pattern has been formed on GBPJPY M15. Characteristics: the support level 193.47; the resistance level 193.69; the width of the pattern 22 points. If the resistance level
The M5 and M15 time frames may have more false entry points.
Открыть график инструмента в новом окне
Bullish Rectangle
сформирован 02.06 в 06:00:14 (UTC+0)
сила сигнала 2 из 5
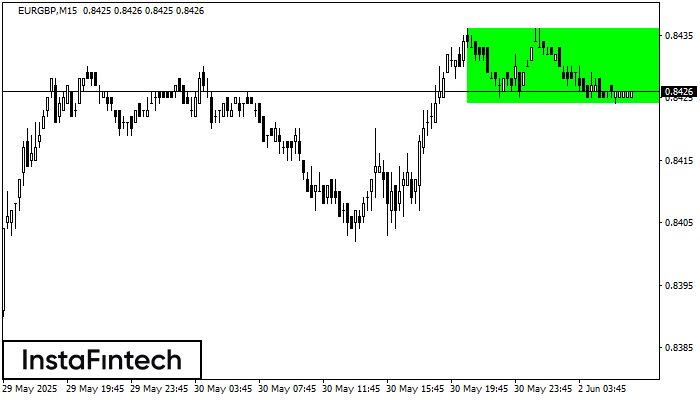
According to the chart of M15, EURGBP formed the Bullish Rectangle. This type of a pattern indicates a trend continuation. It consists of two levels: resistance 0.8436 and support 0.8424
The M5 and M15 time frames may have more false entry points.
Открыть график инструмента в новом окне


