

Dolzarb patternlar

Двойная вершина
сформирован 17.04 в 17:00:07 (UTC+0)
сила сигнала 3 из 5
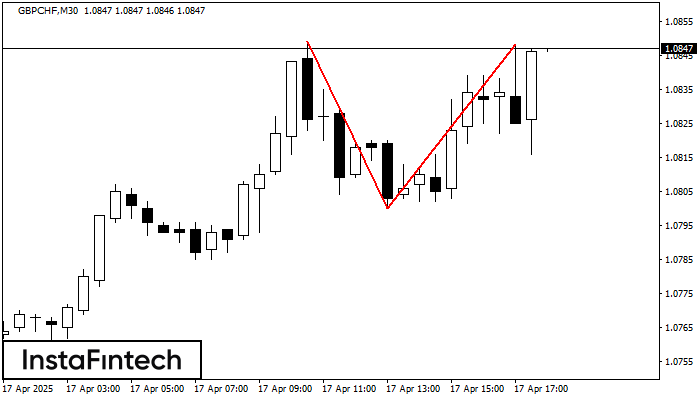
По торговому инструменту GBPCHF на M30 сформировалась фигура «Двойная вершина», которая сигнализирует нам об изменении тенденции с восходящей на нисходящую. Вероятно, что, в случае пробоя основания фигуры 1.0800, возможно дальнейшее нисходящее движение.
- Все
- Все
- Bearish Rectangle
- Bearish Symmetrical Triangle
- Bearish Symmetrical Triangle
- Bullish Rectangle
- Double Top
- Double Top
- Triple Bottom
- Triple Bottom
- Triple Top
- Triple Top
- Все
- Все
- Покупка
- Продажа
- Все
- 1
- 2
- 3
- 4
- 5
Double Bottom
сформирован 02.06 в 01:00:44 (UTC+0)
сила сигнала 3 из 5
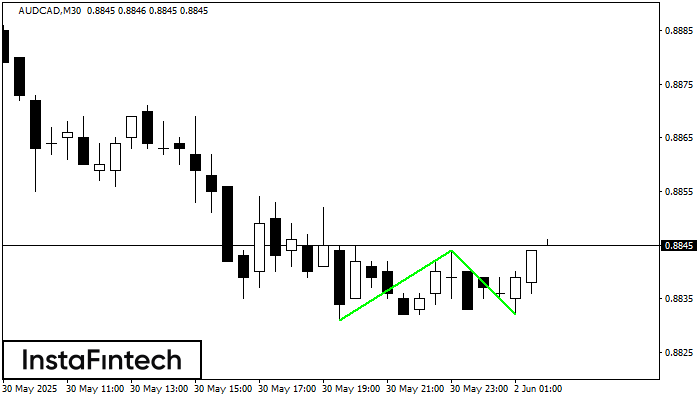
The Double Bottom pattern has been formed on AUDCAD M30. Characteristics: the support level 0.8831; the resistance level 0.8844; the width of the pattern 13 points. If the resistance level
Открыть график инструмента в новом окне
Bullish pennant
сформирован 02.06 в 00:35:10 (UTC+0)
сила сигнала 1 из 5
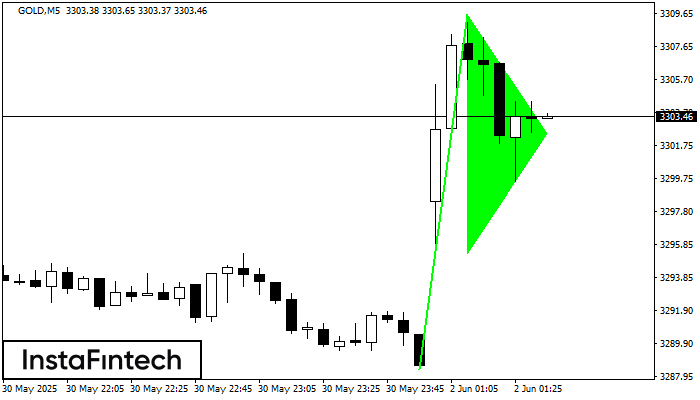
The Bullish pennant pattern is formed on the GOLD M5 chart. It is a type of the continuation pattern. Supposedly, in case the price is fixed above the pennant’s high
The M5 and M15 time frames may have more false entry points.
Открыть график инструмента в новом окне
Double Bottom
сформирован 02.06 в 00:30:12 (UTC+0)
сила сигнала 2 из 5
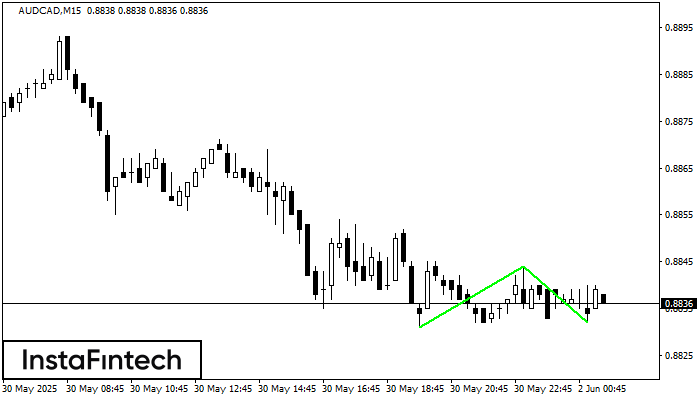
The Double Bottom pattern has been formed on AUDCAD M15. This formation signals a reversal of the trend from downwards to upwards. The signal is that a buy trade should
The M5 and M15 time frames may have more false entry points.
Открыть график инструмента в новом окне


