Dolzarb patternlar

Тройное дно
сформирован 17.04 в 23:00:34 (UTC+0)
сила сигнала 2 из 5
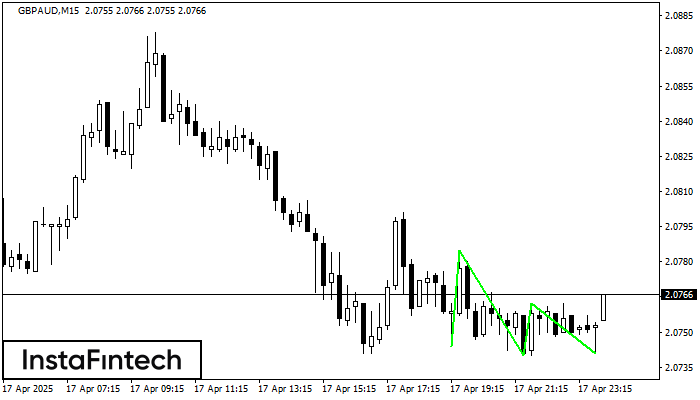
Сформирована фигура «Тройное дно» по торговому инструменту GBPAUD на M15. Фигура сигнализирует об изменении тенденции с нисходящей на восходящую в случае пробоя верхней границы 2.0762.
Таймфреймы М5 и М15 могут иметь больше ложных точек входа.
- Все
- Все
- Bearish Rectangle
- Bearish Symmetrical Triangle
- Bearish Symmetrical Triangle
- Bullish Rectangle
- Double Top
- Double Top
- Triple Bottom
- Triple Bottom
- Triple Top
- Triple Top
- Все
- Все
- Покупка
- Продажа
- Все
- 1
- 2
- 3
- 4
- 5
Bearish Symmetrical Triangle
сформирован 30.04 в 06:15:48 (UTC+0)
сила сигнала 1 из 5

According to the chart of M5, USDCHF formed the Bearish Symmetrical Triangle pattern. This pattern signals a further downward trend in case the lower border 0.8226 is breached. Here
The M5 and M15 time frames may have more false entry points.
Открыть график инструмента в новом окне
Triple Bottom
сформирован 30.04 в 05:45:24 (UTC+0)
сила сигнала 1 из 5

The Triple Bottom pattern has formed on the chart of GBPAUD M5. Features of the pattern: The lower line of the pattern has coordinates 2.0938 with the upper limit 2.0938/2.0931
The M5 and M15 time frames may have more false entry points.
Открыть график инструмента в новом окне
Bearish pennant
сформирован 30.04 в 05:22:56 (UTC+0)
сила сигнала 2 из 5

The Bearish pennant pattern has formed on the GBPAUD M15 chart. It signals potential continuation of the existing trend. Specifications: the pattern’s bottom has the coordinate of 2.0901; the projection
The M5 and M15 time frames may have more false entry points.
Открыть график инструмента в новом окне