

Các mẫu thực tế

Các mẫu là các mô hình đồ họa được hình thành trong biểu đồ theo giá. Theo một trong những định đề phân tích kỹ thuật, lịch sử (chuyển động giá) thường tự lặp lại. Có nghĩa là biến động giá thường giống nhau trong các tình huống giống nhau, do đó có thể dự đoán chuyển động tiếp theo của tình huống với xác suất cao.
Các mẫu hữu quan của InstaTrade là một dịch vụ dễ sử dụng cho phép bạn nhận biết được những thay đổi mới nhất trên thị trường và phản ứng kịp thời với các dấu hiệu từ thị trường. Trong dịch vụ của chúng tôi, bạn sẽ luôn tìm thấy các mẫu mới nhất và phù hợp nhất trên bất kỳ cặp nào và bất kỳ khung thời gian nào.
Bullish Symmetrical Triangle
was formed on 16.04 at 17:01:05 (UTC+0)
signal strength 4 of 5
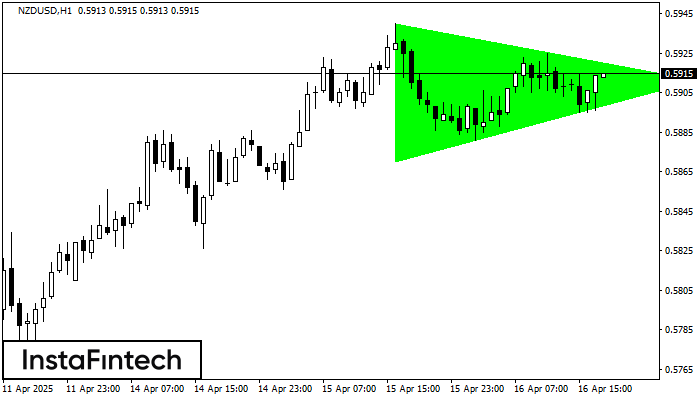
According to the chart of H1, NZDUSD formed the Bullish Symmetrical Triangle pattern, which signals the trend will continue. Description. The upper border of the pattern touches the coordinates 0.5940/0.5911 whereas the lower border goes across 0.5870/0.5911. The pattern width is measured on the chart at 70 pips. If the Bullish Symmetrical Triangle pattern is in progress during the upward trend, this indicates the current trend will go on. In case 0.5911 is broken, the price could continue its move toward 0.5951.
- All
- All
- Bearish Rectangle
- Bearish Symmetrical Triangle
- Bearish Symmetrical Triangle
- Bullish Rectangle
- Double Top
- Double Top
- Triple Bottom
- Triple Bottom
- Triple Top
- Triple Top
- All
- All
- Buy
- Sale
- All
- 1
- 2
- 3
- 4
- 5
Прямоугольник
сформирован 31.05 в 19:15:46 (UTC+0)
сила сигнала 1 из 5

По торговому инструменту #Bitcoin на M5 сформировалась фигура продолжения тренда - «Прямоугольник». Фигура имеет границы: Нижняя 104335.43; Верхняя 104800.13. В случае пробоя верхней границы вероятно дальнейшее движение в сторону тренда
Таймфреймы М5 и М15 могут иметь больше ложных точек входа.
Открыть график инструмента в новом окне
Двойное дно
сформирован 31.05 в 13:20:01 (UTC+0)
сила сигнала 1 из 5

Сформирована фигура «Двойное дно» на графике #Bitcoin M5. Характеристика: Уровень поддержки 103250.25; Уровень сопротивления 103385.09; Ширина фигуры 13484 пунктов. В случае пробоя уровня сопротивления можно будет прогнозировать изменение тенденции
Таймфреймы М5 и М15 могут иметь больше ложных точек входа.
Открыть график инструмента в новом окне
Тройная вершина
сформирован 30.05 в 22:20:23 (UTC+0)
сила сигнала 1 из 5

По GOLD на M5 сформировалась фигура «Тройная вершина». Характеристика: Границы имеют восходящий угол. Нижняя граница фигуры имеет координаты 3289.23/3291.16, при этом верхняя граница 3295.36/3295.32. Проекция ширины 613 пунктов. Формирование фигуры
Таймфреймы М5 и М15 могут иметь больше ложных точек входа.
Открыть график инструмента в новом окне
