

Các mẫu thực tế

Các mẫu là các mô hình đồ họa được hình thành trong biểu đồ theo giá. Theo một trong những định đề phân tích kỹ thuật, lịch sử (chuyển động giá) thường tự lặp lại. Có nghĩa là biến động giá thường giống nhau trong các tình huống giống nhau, do đó có thể dự đoán chuyển động tiếp theo của tình huống với xác suất cao.
Các mẫu hữu quan của InstaTrade là một dịch vụ dễ sử dụng cho phép bạn nhận biết được những thay đổi mới nhất trên thị trường và phản ứng kịp thời với các dấu hiệu từ thị trường. Trong dịch vụ của chúng tôi, bạn sẽ luôn tìm thấy các mẫu mới nhất và phù hợp nhất trên bất kỳ cặp nào và bất kỳ khung thời gian nào.
Triple Top
was formed on 17.04 at 23:00:24 (UTC+0)
signal strength 2 of 5
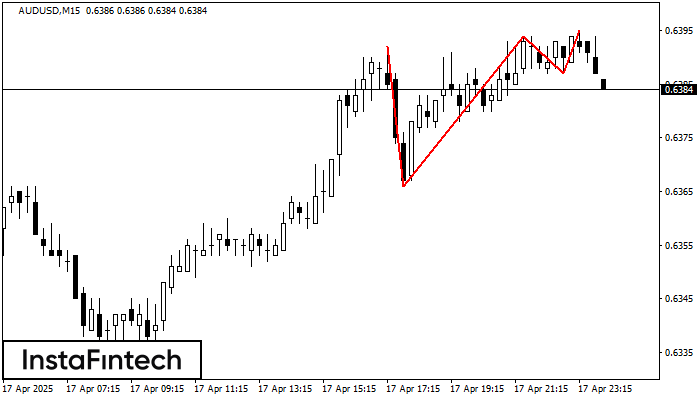
The Triple Top pattern has formed on the chart of the AUDUSD M15 trading instrument. It is a reversal pattern featuring the following characteristics: resistance level -3, support level -21, and pattern’s width 26. Forecast If the price breaks through the support level 0.6366, it is likely to move further down to 0.6371.
The M5 and M15 time frames may have more false entry points.
- All
- All
- Bearish Rectangle
- Bearish Symmetrical Triangle
- Bearish Symmetrical Triangle
- Bullish Rectangle
- Double Top
- Double Top
- Triple Bottom
- Triple Bottom
- Triple Top
- Triple Top
- All
- All
- Buy
- Sale
- All
- 1
- 2
- 3
- 4
- 5
Bawah Ganda
was formed on 29.05 at 15:00:17 (UTC+0)
signal strength 2 of 5
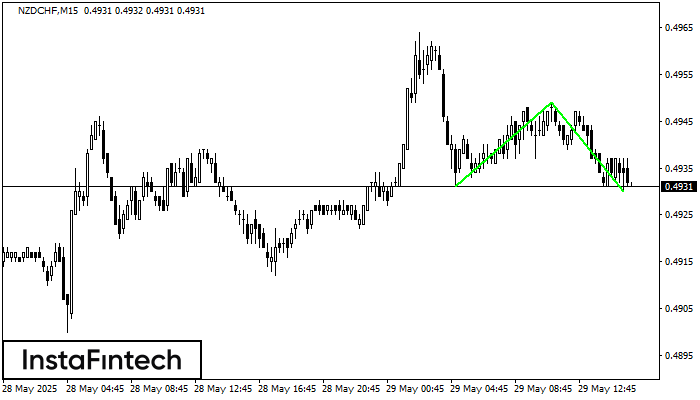
Pola Bawah Ganda telah terbentuk pada NZDCHF M15; batas atas di 0.4949; batas bawah di 0.4930. Lebar pola sebesar 18 poin. Jika harga menembus batas atas 0.4949, Perubahan dalam tren
Rangka waktu M5 dan M15 mungkin memiliki lebih dari titik entri yang keliru.
Open chart in a new window
Persegi Bearish
was formed on 29.05 at 14:04:55 (UTC+0)
signal strength 2 of 5
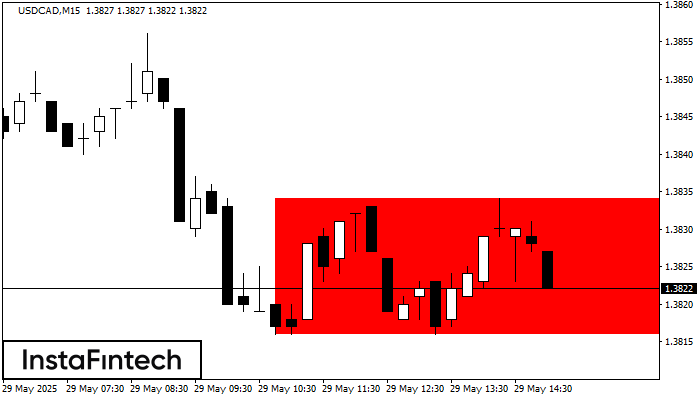
Menurut grafik dari M15, USDCAD terbentuk Persegi Bearish. Pola menunjukkan kelanjutan tren. Batas atas adalah 1.3834, batas rendah adalah 1.3816. Sinyal berarti posisi jual harus dibuka setelah menetapkan harga dibawah
Rangka waktu M5 dan M15 mungkin memiliki lebih dari titik entri yang keliru.
Open chart in a new window
Persegi Bearish
was formed on 29.05 at 13:36:16 (UTC+0)
signal strength 1 of 5
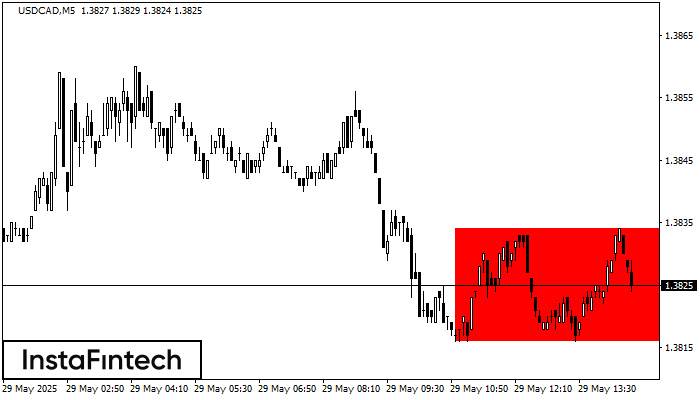
Menurut grafik dari M5, USDCAD terbentuk Persegi Bearish yang merupakan pola dari kelanjutan tren. Pola terkandung di dalam batas berikut: batas lebih rendah 1.3816 – 1.3816 dan batas atas 1.3834
Rangka waktu M5 dan M15 mungkin memiliki lebih dari titik entri yang keliru.
Open chart in a new window
