Pola sebenarnya

Double Bottom
was formed on 07.04 at 21:20:40 (UTC+0)
signal strength 1 of 5
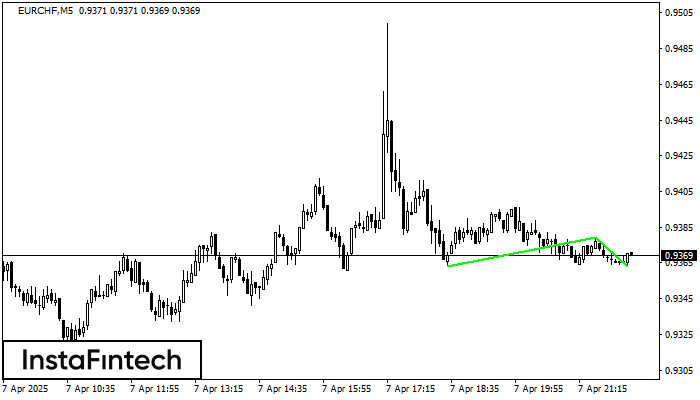
The Double Bottom pattern has been formed on EURCHF M5; the upper boundary is 0.9379; the lower boundary is 0.9363. The width of the pattern is 16 points. In case of a break of the upper boundary 0.9379, a change in the trend can be predicted where the width of the pattern will coincide with the distance to a possible take profit level.
The M5 and M15 time frames may have more false entry points.
Lihat juga
- All
- All
- Bearish Rectangle
- Bearish Symmetrical Triangle
- Bearish Symmetrical Triangle
- Bullish Rectangle
- Double Top
- Double Top
- Triple Bottom
- Triple Bottom
- Triple Top
- Triple Top
- All
- All
- Buy
- Sale
- All
- 1
- 2
- 3
- 4
- 5
Kepala dan bahu
was formed on 17.04 at 14:00:03 (UTC+0)
signal strength 2 of 5

Pola teknikal yang disebut Kepala dan bahu telah muncul pada grafik EURCHF M15. Terdapat banyak alasan untuk harga melewati Neckline 0.9278/0.9279 setelah Shoulder kanan terbentuk. Jadi, tren akan berubah dengan
Rangka waktu M5 dan M15 mungkin memiliki lebih dari titik entri yang keliru.
Open chart in a new window
Segitiga Simetris Bearish
was formed on 17.04 at 13:58:48 (UTC+0)
signal strength 1 of 5

Menurut Grafik dari M5, GBPUSD dibentuk pola Segitiga Simetris Bearish. Rekomendasi Trading: Penembusan dari batas yang lebih rendah 1.3203 kemungkinan akan mendorong kelanjutan dari tren penurunan
Rangka waktu M5 dan M15 mungkin memiliki lebih dari titik entri yang keliru.
Open chart in a new window
Segitiga Simetris Bearish
was formed on 17.04 at 13:57:41 (UTC+0)
signal strength 3 of 5

Menurut Grafik dari M30, EURUSD dibentuk pola Segitiga Simetris Bearish. Pola ini mengisyaratkan tren penurunan lebih lanjut jika terdapat batas yang lebih rendah 1.1264 ditembus. Disini, sebuah keuntungan hipotetis akan
Open chart in a new window